

For over ten years, I’ve wanted a better embedded log viewer, specifically for Bluetooth LE work.
That’s a long time, especially for a Bluetooth LE engineer staring at HCI hex dumps in a tool that hasn’t really changed since the 90s. Every Bluetooth LE debug session goes the same way: plain text scrolling by, no filtering, no structure, no way to see what your firmware is actually doing without piecing it together across SEGGER J-Link RTT Viewer (for the live log), a serial terminal (for the UART side), and Wireshark (for the HCI capture you exported five minutes ago). If you’ve ever spent an afternoon alt-tabbing between three windows trying to correlate a pairing failure with a hard fault in your application logs, you know exactly the workflow I’m talking about.
In March 2026, I finally built the tool I wished existed. It’s called LogScope, it’s free, it’s open source, and it lives inside VS Code. In this post, let’s walk through:
- Why J-Link RTT Viewer never quite worked for my workflow
- What changed in 2026 that made building a replacement realistic
- How LogScope went from blank repo to a working extension in about six hours
- Why I think the real differentiator just shifted, now that AI coding agents have collapsed the activation energy
- What the launch on LinkedIn showed me about who else felt the same itch
- Where LogScope is now, and what’s coming next
If you’ve ever wished your embedded debugging tools were a little less stuck in 1998, this should resonate.
Where J-Link RTT Viewer falls short for me
Let’s be fair to SEGGER first. J-Link RTT Viewer is a genuinely good tool. It’s reliable. It works with any J-Link probe (which is most of the Nordic, ST, Silicon Labs, Infineon, and NXP ecosystem). It handles the transport layer cleanly. For a lot of bring-up work, it’s the right tool.
The problem isn’t that it’s bad. The problem is that it’s narrow.
Here’s what bothered me as a Bluetooth LE engineer for years:
Everything lives outside the editor. J-Link RTT Viewer is a standalone desktop application. Every debug session means alt-tabbing between VS Code (where my firmware code lives), RTT Viewer (where the logs scroll by), a serial terminal (for the UART side of things), and Wireshark (for HCI captures). That’s four windows for one workflow.
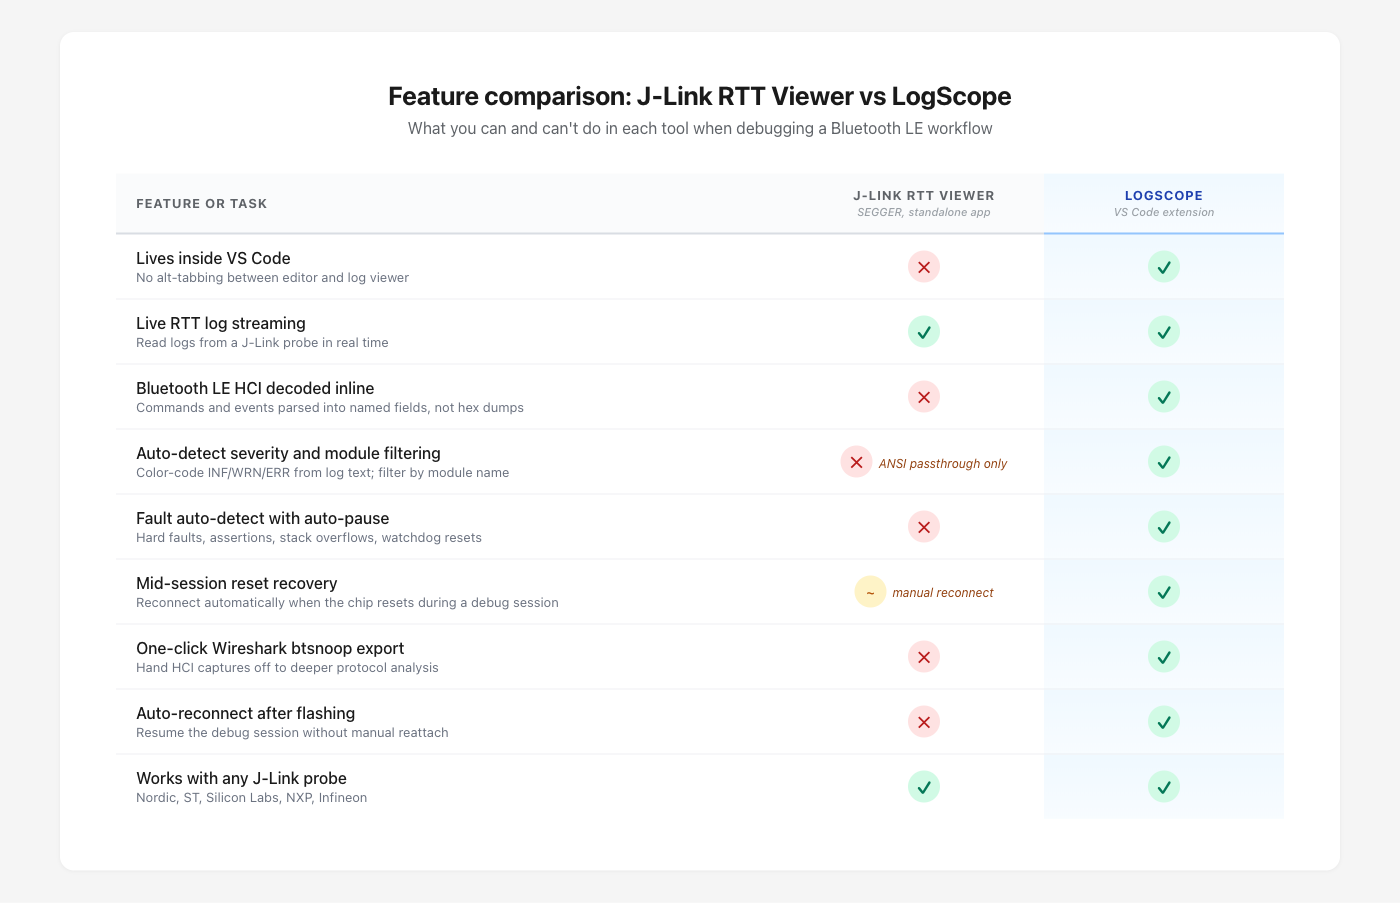
Feature-by-feature comparison: J-Link RTT Viewer versus LogScope across the debug-workflow capabilities that matter for Bluetooth LE work.
The output is plain text. A modern log line in a
structured RTOS like Zephyr or
nRF Connect SDK carries severity, module name, timestamp, and the actual
message, all parseable. RTT Viewer shows you the raw text stream. You
write the parsing in your head, every line, every session. For example,
a Zephyr log entry that prints
[00:00:01.234,000] <inf> sensor_drv: temp=22.5C
should at minimum show up with the severity color-coded, the module name
in its own column, and the timestamp in a sortable format. In RTT
Viewer, it’s just text.
Mid-session resets disrupt the connection. This is the issue that bothered me most as I built more complex Bluetooth LE work. If your firmware does a soft reset (which, on a peripheral, can happen often during pairing failures and connection drops), RTT Viewer typically loses sync with the RTT control block and you have to manually reconnect to resume the log stream. For a tool designed to follow what your firmware is doing, that’s a brutal limitation.
There’s no Bluetooth LE awareness. This is the one
that drove me to actually start building, and it’s the heart of the
whole story. A Bluetooth LE engineer staring at HCI packet bytes (or
worse, raw ACL bytes) is doing protocol decoding by hand, which is
exactly the kind of mechanical work software should do for us. Every
byte of an HCI command has a meaning defined in the Bluetooth
Core Specification. Every ATT operation has a structured field
layout. Why am I reading hex dumps when the spec tells us exactly what
each byte is? For example, an HCI LE Connection Complete
event carries the connection status, handle, role, peer address (with
type), connection
interval, peripheral latency, supervision timeout, and central clock
accuracy. That’s eight pieces of information a Bluetooth LE engineer
cares about, every connection, every session. Surfacing them inline as
decoded text is not a nice-to-have. It’s the table-stakes feature that
the rest of the tooling industry never built.
For a long time, the answer to “why don’t you just build something better” was: because building something better takes months, I have a day job (Novel Bits and the Bluetooth Developer Academy), and the activation energy is too high.
That changed in 2026.
What changed in 2026
The honest answer is: AI coding agents got good enough to ship real tools.
Let’s be specific about what that means, because there’s a lot of noise in this space. I’m a Bluetooth LE engineer. I’ve been doing this work for over a decade. I know the Core Specification well enough that I built the bluetooth-spec MCP server (a retrieval system over the spec, used by my other tools too). What I’m not is a TypeScript expert who lives inside the VS Code extension API. I don’t write Astro plugins for breakfast. I haven’t internalized every corner of the J-Link DLL or the SEGGER RTT control-block format.
For years, that gap between “domain knowledge” and “tooling knowledge” was where my better-log-viewer idea died. The mechanical work of building a VS Code extension (wiring up activation events, managing the webview lifecycle, designing the message-passing protocol, scaffolding a parser pipeline) would have taken me weeks of part-time work just to reach the point where I could start solving the actual Bluetooth LE problems.
With Claude Code (the AI coding agent I used to build LogScope), the math is different. I supply the judgment: what to parse, what to surface, what HCI fields a Bluetooth LE engineer actually needs to see, how the connection-parameter visualization should work. Claude handles the mechanics: the VS Code extension API, the TypeScript types, the parser scaffolding, the webview rendering.
This is the “build in public with AI” angle of the LogScope story, and I think it’s worth being explicit about it. The interesting part isn’t that AI wrote code. The interesting part is that for the first time, a domain expert without deep tooling-internals expertise can ship serious developer tools in their niche. For Bluetooth LE specifically, that’s me. For other niches, it’ll be other people, and that’s good for everyone.
From blank repo to working extension in six hours
Let’s walk through the actual timeline, because the contrast with where I started matters.
On 2026-03-17 at 15:22 (a Sunday afternoon, for context), I made the initial commit: just an MIT license file and a README. Six hours later, at 21:02 the same day, the next commit was the “thin slice”: a working VS Code extension that connected to a J-Link probe via RTT, parsed Zephyr log output, and rendered the results in a filterable webview. Four-layer architecture (transport, parser, model, UI), 33 passing tests, packaged as a VSIX ready to install.
A few minutes after midnight on March 18, I added auto-J-Link integration so the extension would spawn JLinkExe automatically on connect (zero-config RTT setup for the user). Then I added a demo firmware app for the nRF54L15 DK so I could test it against real hardware. I renamed the project from “Devscope” to “DevScope”, and then a few commits later, again to “LogScope”, because both earlier names were too close to existing projects.
The rest of March 18 went into HCI decoding. By the end of that day,
the extension could capture Bluetooth LE HCI packets from Zephyr’s
btmonitor channel, decode them inline (commands, events,
ACL data, ATT operations), and let you click any row to expand the
decoded fields. Crash and fault detection landed in the same window.
On March 19, I shipped v0.1.0 (well, technically v0.1.7 by then; there were a few publishing iterations) to the VS Code Marketplace and posted on LinkedIn.
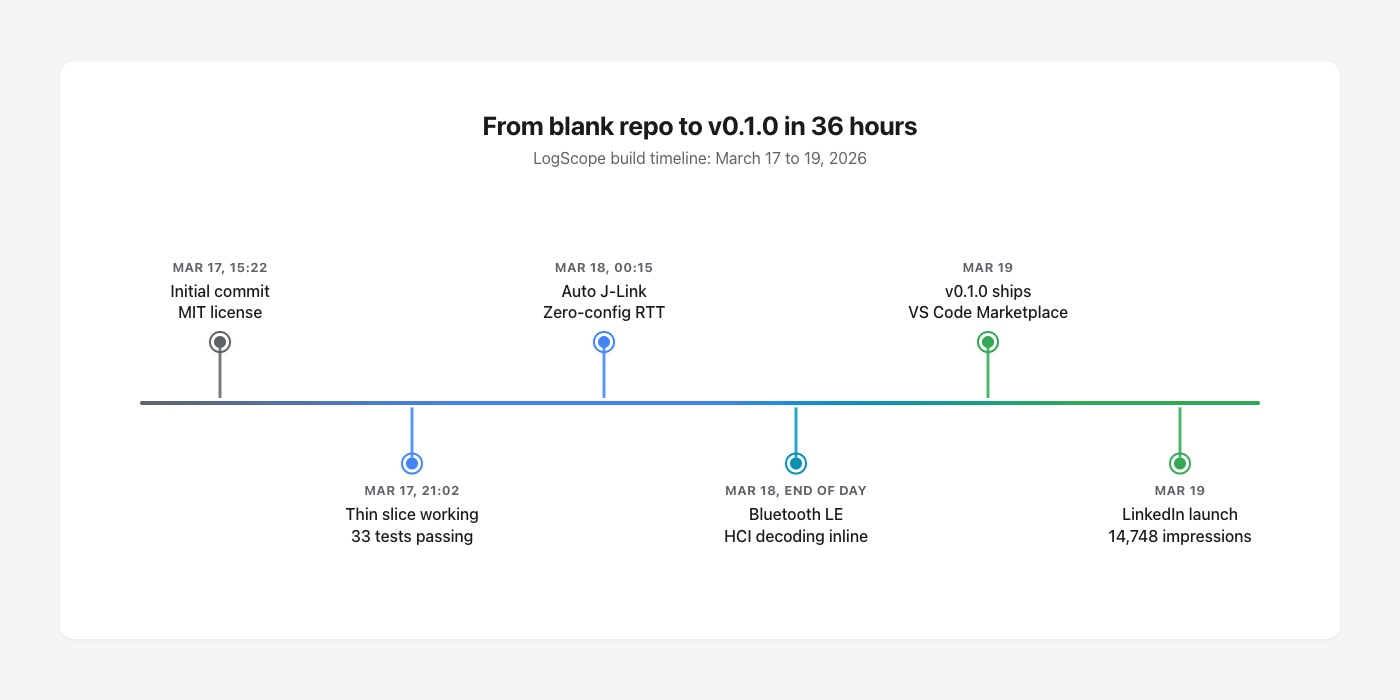
Build timeline: from blank repo to v0.1.0 shipped, plus the LinkedIn launch, in about 36 hours.
That’s about 36 hours from “I should just build this” to “anyone can install it from the Marketplace.” I’m not claiming I understood every J-Link DLL behavior the first day. I didn’t, and that knowledge has come in painful pieces over the months since, especially around the mid-session reset bug that took two weeks to actually fix later. What I’m saying is the activation energy is now low enough that domain experts can ship.
For example, when I needed to handle the SEGGER RTT control-block format, I didn’t have to read the SEGGER spec first. Claude already knew the pattern (the magic string, the up-buffer / down-buffer layout, the descriptor structure). I just had to confirm it produced output that matched what real Nordic firmware emits, which I could verify against a real nRF54L15 DK on my desk.
The Bluetooth LE side, by contrast, was all me. Which HCI events matter most to surface? Which ATT operations need decoded fields versus a hex dump fallback? How should connection parameters render so they’re actually useful (interval, latency, supervision timeout, all in the units engineers actually think in)? Those decisions came from more than a decade of staring at Bluetooth LE traces.
The differentiator just shifted
I want to pause here for a second, because this is the part of the story I think matters most. It’s also why I’m building LogScope in public rather than treating it as a quiet side project.
For decades, the bottleneck for shipping software was writing it. If you wanted a tool that didn’t exist, you either built it yourself (slowly), waited for someone with the time and skill to build it, or paid a company to build it for you. “Can they write the code” was a real filter, and it kept a lot of would-be tools from ever existing.
In 2026, that filter is collapsing. Domain experts, indie hackers, and product people are shipping real software with AI coding agents, often at a speed that would have looked impossible two years ago. The bottleneck isn’t writing code anymore. It’s everything else.
What does “everything else” mean in practice? For LogScope specifically, it’s decisions like these:
- Which seven HCI fields actually matter when an engineer is debugging a Bluetooth LE connection drop? That answer comes from doing the work for over a decade, not from reading the spec.
- What does the connection-parameter visualization need to show at a glance, and what can wait until the user clicks to expand a row? You learn that by watching your own eyes flick across logs in real debug sessions.
- When the chip resets mid-session, what should the UI do in the half-second before logs resume? You learn that by losing your session a hundred times in J-Link RTT Viewer.
- Should the auto-detect feature surface the chip name, the J-Link device name, both, or just “connected”? You learn that by talking to embedded engineers about how they actually think about their boards.
None of those are coding problems. They’re judgment problems, born from doing the work.
So my honest take is that the next several years of indie tool-building belong to people who combine deep domain experience with a real sense of how products feel to use. The code is the easy part now. The hard part, and the differentiator, is knowing which problems are actually worth solving and what “actually solved” looks like for the user.
Design intuition, workflow empathy, and the patience to ship something that’s good and not just working are about to matter more than ever. LogScope is my bet on that thesis.
The launch moment
Let’s talk about what happened next, because the response taught me as much as the build did.
I posted the founding announcement on LinkedIn the morning of March 19, 2026. Short video demo of the extension in action, the same “for over ten years I’ve wanted to build this” framing, the Marketplace link in the first comment.
The post has reached 17,947 impressions, 256 reactions, 22 comments, and 10 reposts. That’s by far the largest reach I’ve had on any LogScope-related post since.
What that response told me was that the itch wasn’t just mine. A lot of embedded engineers have the same alt-tab-between-three-windows debugging workflow, and they recognized it the second they saw the video. The most common comment was a variant of: “I’ve been wanting exactly this.” A few people asked for nRF5 SDK parser support immediately (which shipped in v0.3.0 two weeks later). A couple asked for non-Nordic chip support (working on it). One Nordic engineer reached out separately to say it was useful for their internal work.
Where LogScope is now
Let’s look at where LogScope stands today, two months after the founding post.
The current version is v0.6.5 (May 2026). Shipping cadence has been one to three releases per month. Before the feature list, the positioning matters: LogScope is built by a Bluetooth LE engineer for Bluetooth LE engineers first. It works for any J-Link-based embedded project (Nordic, ST, Silicon Labs, NXP, Infineon, generic Cortex-M targets), and a lot of the value (live log streaming, severity filtering, Wireshark export, fault auto-detection) serves general embedded work just fine. But the features that genuinely distinguish LogScope from any other RTT viewer are all things only someone deep in Bluetooth LE would think to build: the inline HCI decoding, the upcoming Bluetooth Core Spec hyperlinks, the connection-parameter visualization, the fault detection tuned for Zephyr Bluetooth stack failures, and the btsnoop export pipeline. If you do general embedded work, LogScope serves you well. If you do Bluetooth LE work, it serves you better.
The major moves since v0.1.0:
- Bluetooth LE HCI decoding inline with 14+ packet decoders (HCI commands and events, ACL/ATT/GATT operations, expandable detail views)
- Direct-memory RTT recovery (v0.6.0), which solved the mid-session reset bug that broke J-Link RTT Viewer in the same scenarios
- Fault auto-detect for hard faults, bus faults, Zephyr fatal errors, assertions, stack overflows, and watchdog resets
- Wireshark btsnoop export so HCI captures hand off cleanly to deeper protocol analysis
- Multi-parser support (Zephyr, nRF5 SDK, raw mode) so non-Zephyr firmware works too
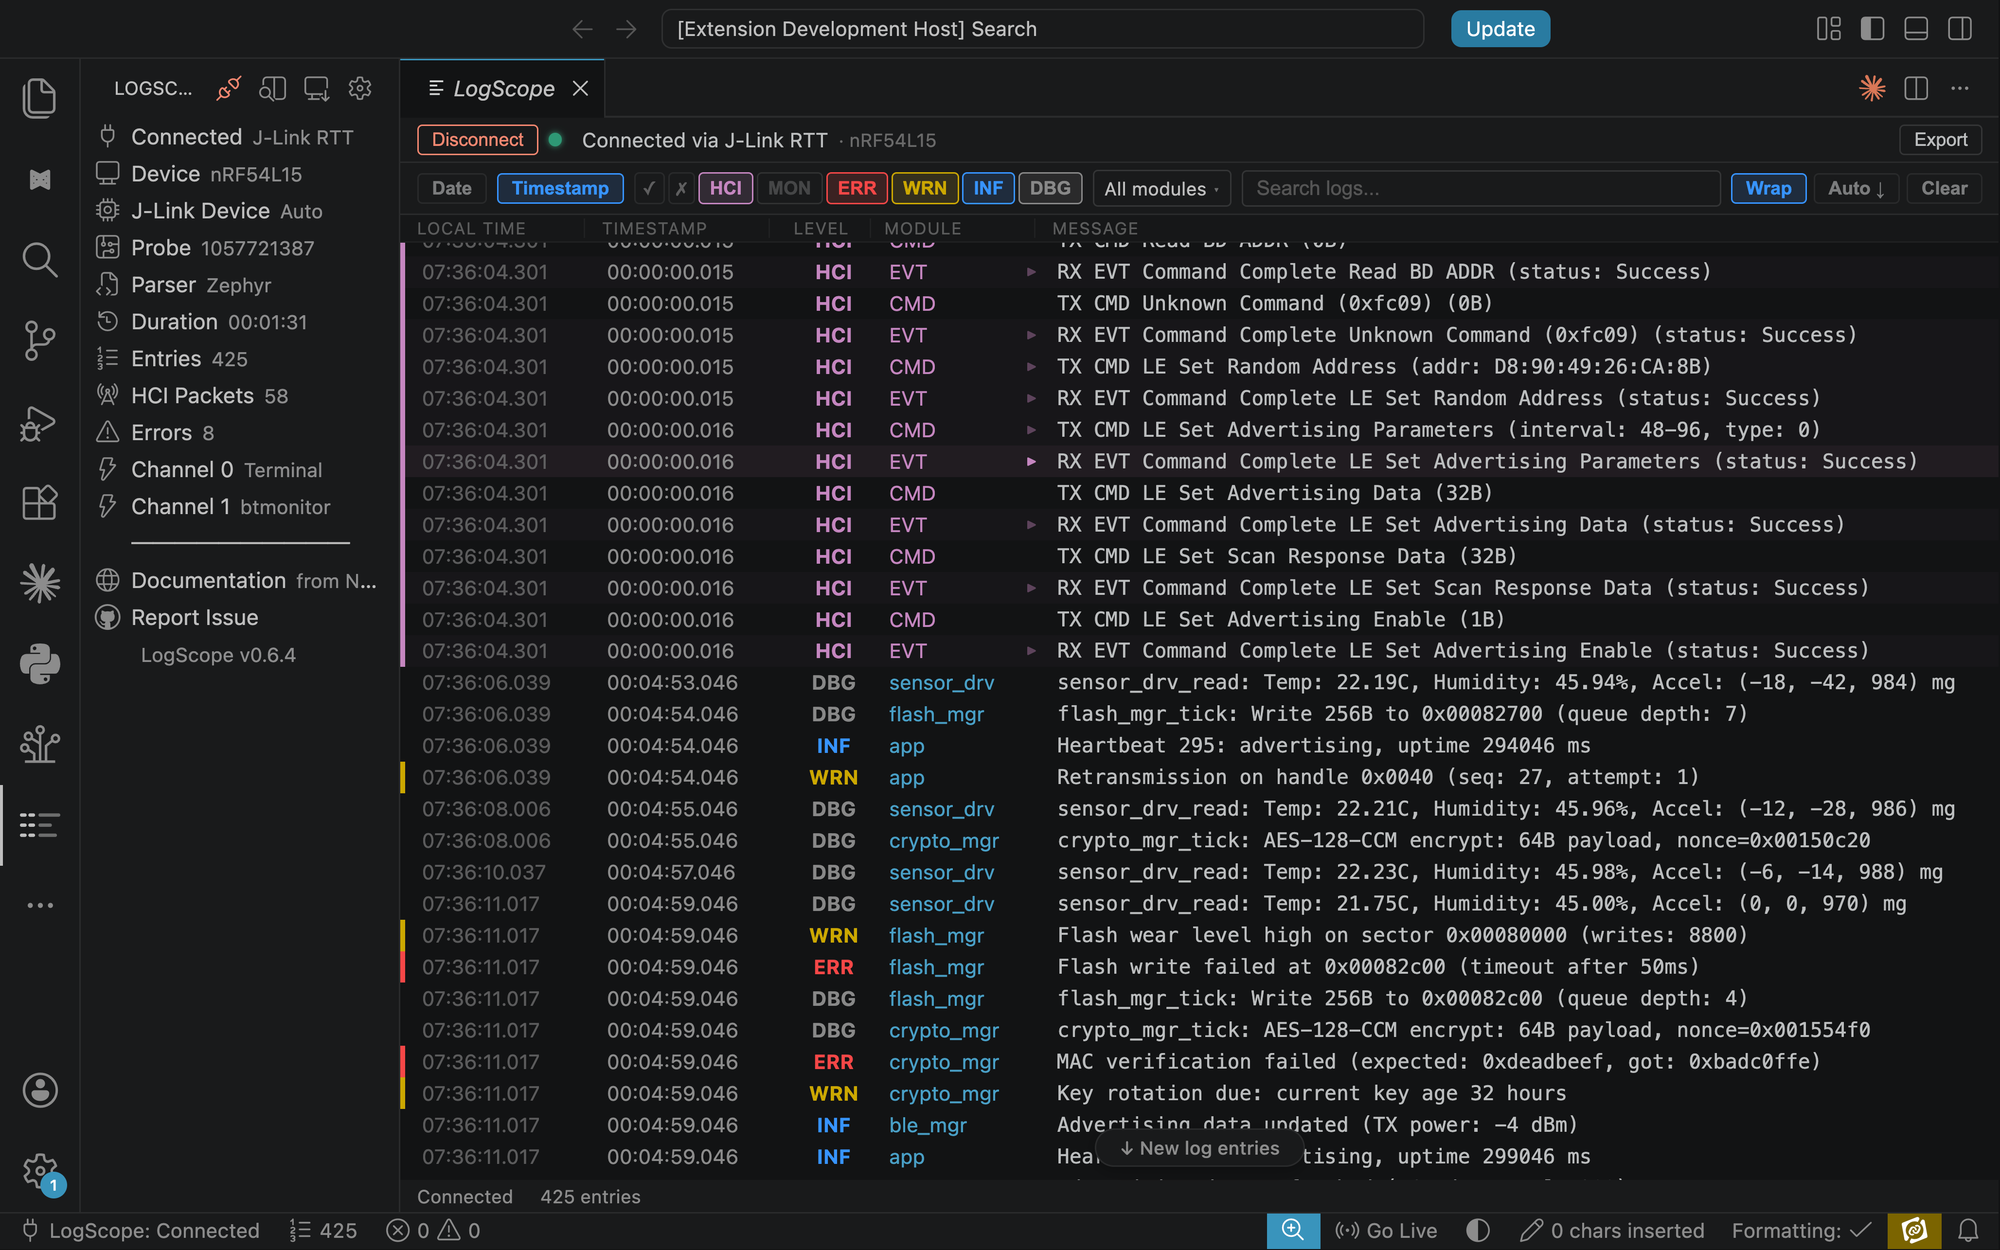
LogScope in action: a live RTT stream from an nRF54L15 DK, with Bluetooth LE HCI commands decoded inline (LE Set Advertising Parameters, LE Set Scan Response Data) alongside Zephyr application logs and fault highlights.
The current focus (v0.7) is full ATT and GATT protocol decoding with inline Bluetooth Core Specification hyperlinks. Click any HCI event, ATT error, or SMP failure code and jump straight to the section in the Core Spec that defines it. That’s a moat that no horizontal AI-for-embedded tool can replicate without building a Bluetooth Core Spec retrieval system of their own, and we already have one.
Every release ships with a dedicated page in the LogScope releases archive, auto-generated from the changelog, so you can see what changed and when.
In this post, we covered:
- Why J-Link RTT Viewer’s plain-text, outside-the-editor, no-Bluetooth-LE-awareness workflow stopped working for me
- How AI coding agents in 2026 dropped the activation energy for shipping niche developer tools
- The six-hour build that took LogScope from blank repo to working extension
- Why I think the real differentiator just shifted from coding skill to domain experience and product judgment
- What the LinkedIn launch showed me about how many engineers had the same itch
- Where LogScope is now (v0.6.5, with v0.7 ATT/GATT decode in flight)
You should now have a clear sense of what LogScope is and why it exists. If you want to try it, it’s a free install on the VS Code Marketplace. If you want to follow along, the GitHub repo is public and the issue tracker is open.


