

Sponsored by Nordic Semiconductor
If you're a wireless engineer, you know that things have changed. These days, Bluetooth Low Energy development is practically bursting with resources.
What started with a simple compiler and flasher has now evolved into a vast world of cutting-edge SDKs, advanced debuggers, power profilers, protocol sniffers, easy-to-use configuration tools, and a multitude of mobile apps.
The vibrant ecosystem surrounding Nordic Semiconductor’s industry-leading SoCs offers incredible potential. While it presents a modern challenge known as the paradox of choice, it also offers an exciting opportunity. With so many effective tools at your disposal, you can explore and discover the ones that best suit your needs, allowing you to find your path to success right from the start.
But let me let you in on a secret that most seasoned developers already know: they typically utilize only a fraction of these tools on any given project. Is that a problem? Absolutely not. It's the hallmark of an efficient workflow.
This post is your strategic guide to navigating a powerful ecosystem. Instead of listing every feature, my goal is to help you understand the landscape and choose the right components for your project, filtering out irrelevant information. Think of this as a roadmap to the Nordic Semiconductor ecosystem, highlighting developer choice and adaptability to help you build better products more efficiently.
Your Command Center
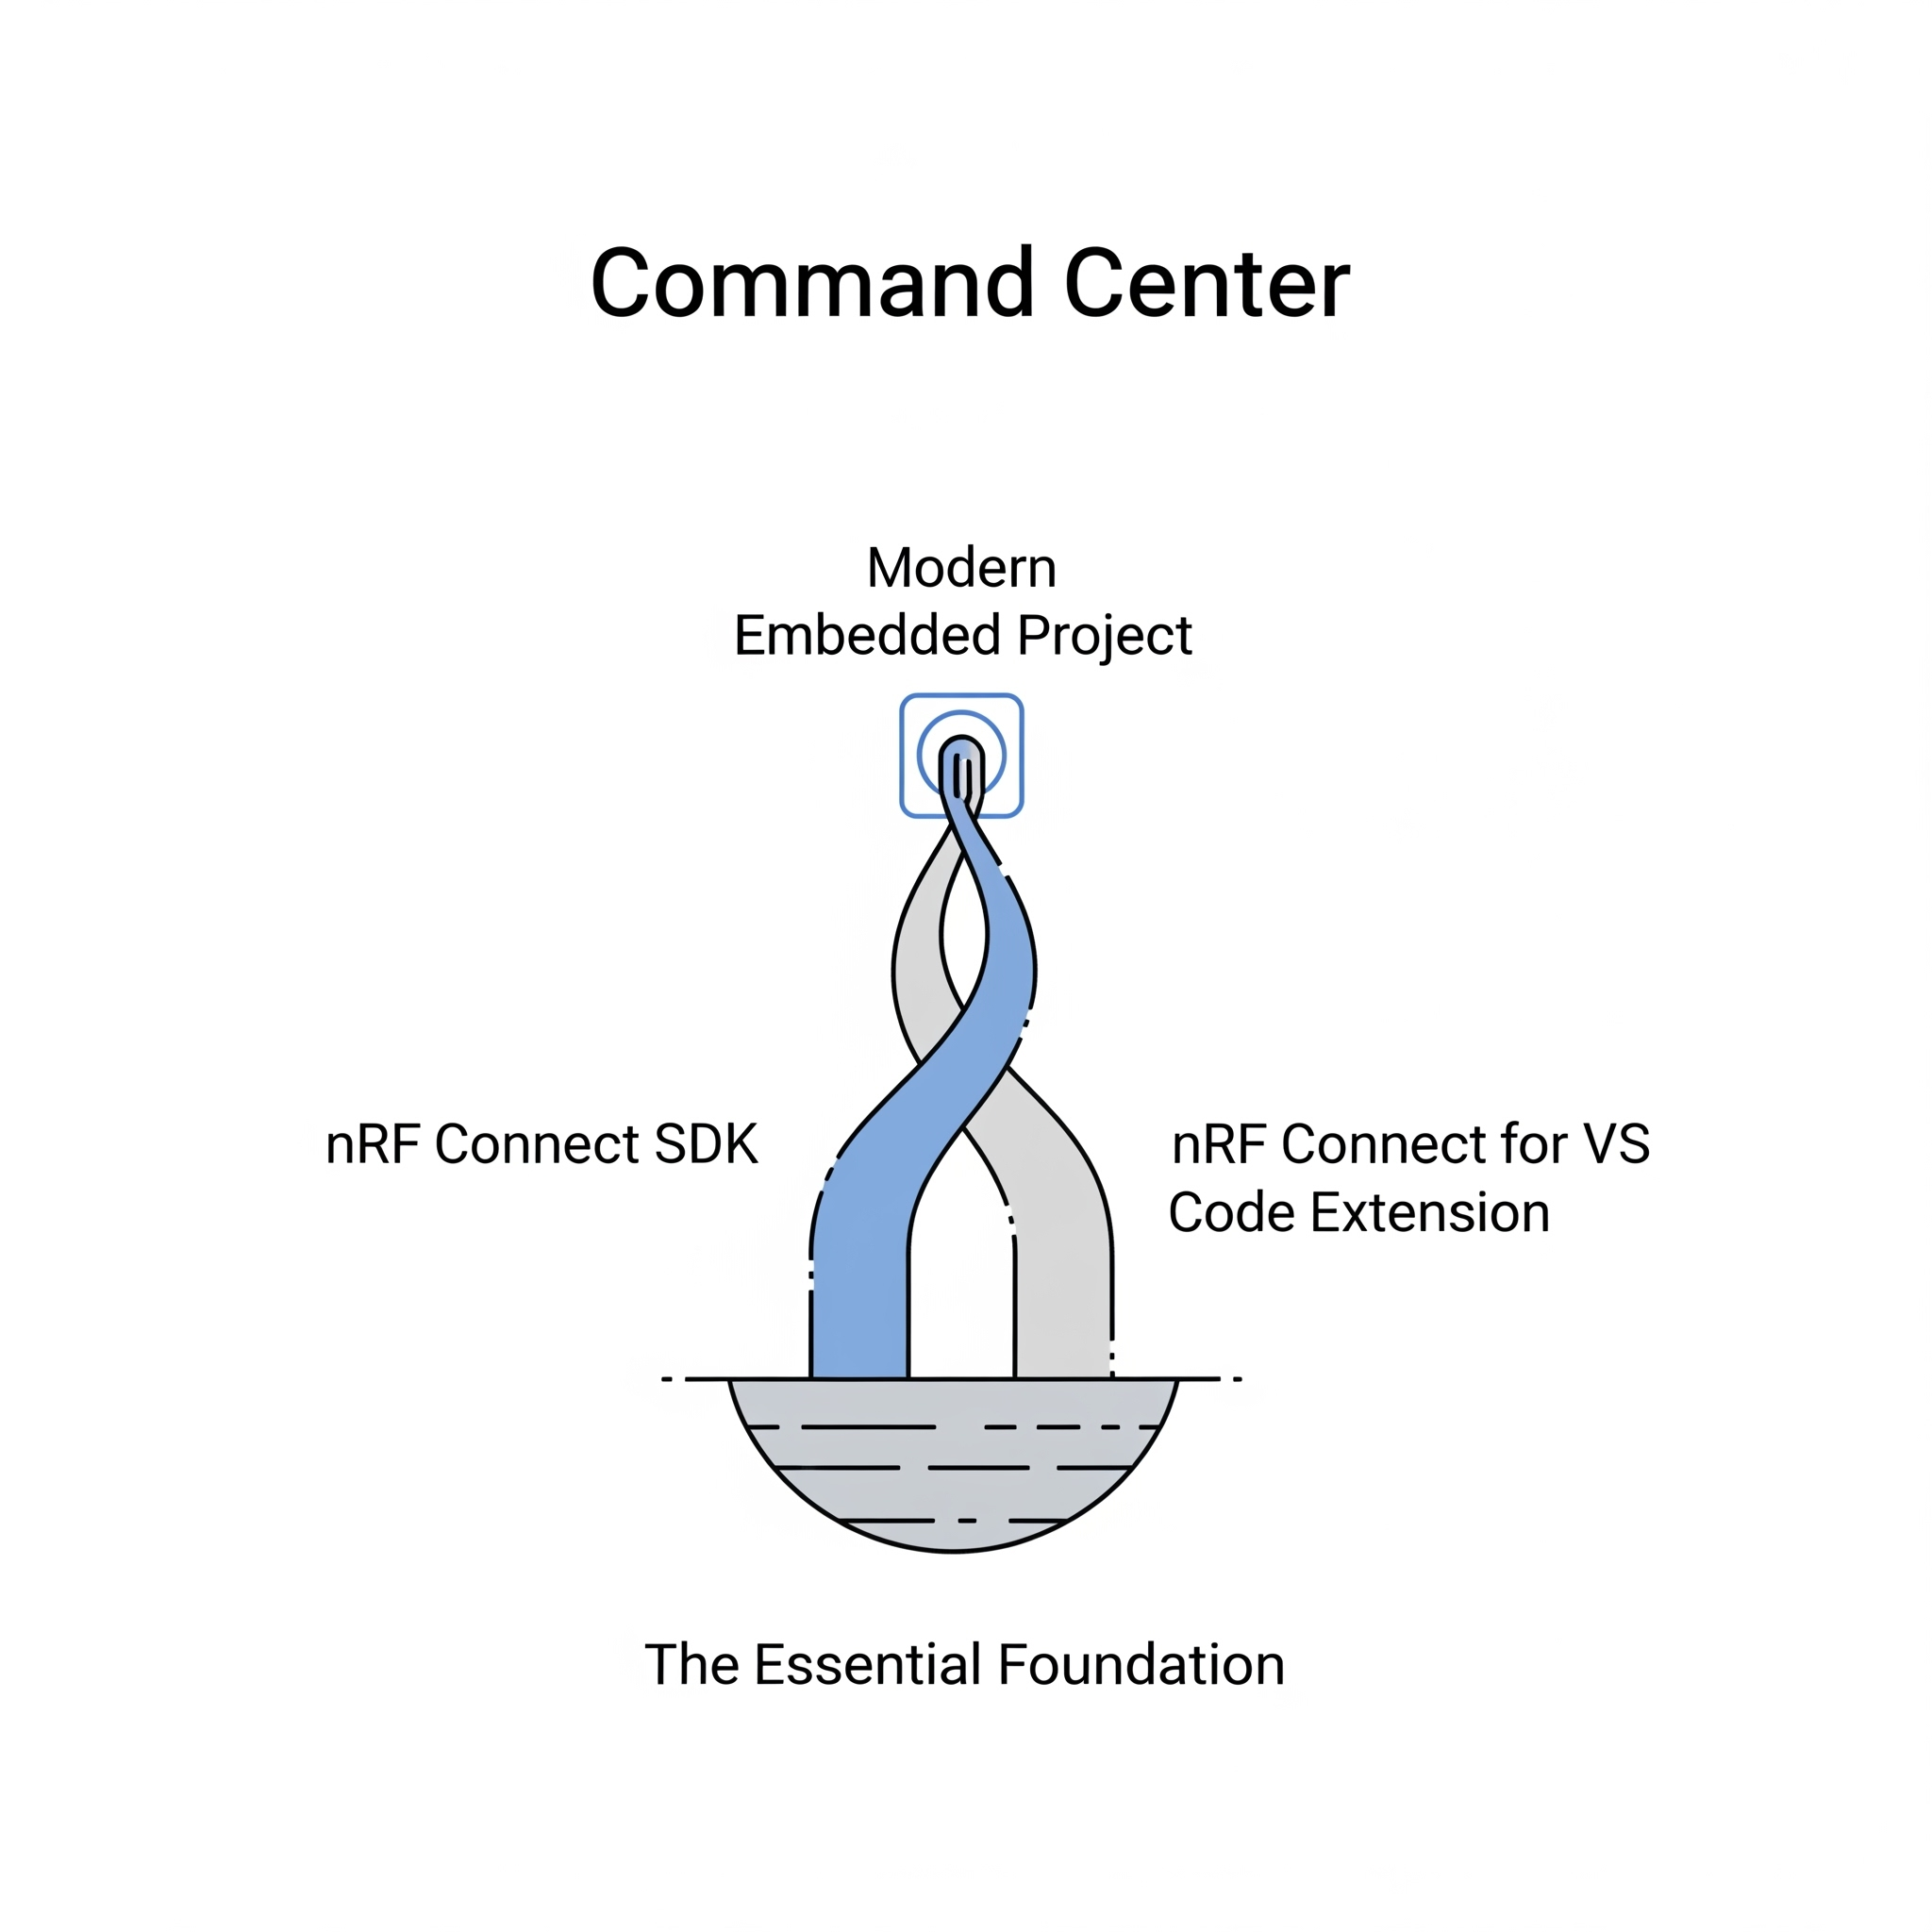
In the world of development tools, every developer needs a reliable home base—a central workbench that offers structure, consistency, and functionality. For those working with Nordic Semiconductor's offerings, this command center is a combination of the nRF Connect SDK and the nRF Connect for VS Code Extension. While other tools play important roles, this duo serves as the essential foundation for almost any modern Bluetooth LE project.
The Foundation: nRF Connect SDK
The nRF Connect SDK is far more than a collection of drivers and Bluetooth libraries. It is a highly scalable and flexible Software Development Kit that has become the foundation of all new development for Nordic’s wireless SoCs, ranging from the workhorse nRF52 Series to the multi-core nRF53 Series and the ultra-low-power nRF54L, as well as the upcoming high-performance nRF54H Series.
Its power lies in its architecture. At its heart is the Zephyr RTOS, a real-time operating system designed for resource-constrained devices. Building upon Zephyr brings several key advantages for developers:
- A Rich Ecosystem of Wireless Stacks and Functionality: Beyond the core RTOS, the SDK integrates a vast array of essential libraries and stacks. This includes not only Nordic’s own finely tuned Bluetooth Low Energy protocol stack, but also a variety of sample applications and implementations of the standard SIG-adopted profiles, as well as stacks for other wireless protocols. This pre-integrated, pre-validated approach saves hundreds of hours of integration effort.
- Scalability and Portability: Zephyr’s modular design allows you to include only the components your application needs, keeping your firmware efficient. An application written for one nRF SoC can be easily ported to another, often with minimal changes. This is a massive advantage when your product line evolves or when you need to target multiple hardware variants.
- Open-Source Accessibility: Because the SDK is built on a foundation of the open-source Zephyr project, developers have full access to the source code of many parts of the stack. This also enables reusable software, faster bug fixing, and accelerates innovation.
The Workbench: nRF Connect for VS Code Extension
If the SDK is the foundation, the nRF Connect for VS Code Extension is the integrated workbench you'll use every day. Visual Studio Code has become the de facto standard for developers across many disciplines, and Nordic has fully adopted it. The extension transforms the general-purpose editor into a specialized, powerful IDE for nRF development.
This is the environment where you will write, build, and debug your code. Its key role is to act as the primary user interface to the underlying nRF Connect SDK and its associated command-line tools. For us developers, this means:
- Unified Toolchain Management: The extension automatically locates and manages the toolchain components (compiler, linker, etc.). This solves one of the most common setup headaches in embedded development, ensuring that every developer on a team is using the same verified toolchain versions.
- Application and Board Awareness: The extension is context-aware. It understands the concept of applications, boards, and build configurations. Through a simple, clean user interface, you can select the application you want to build and the target hardware (e.g.,
nrf5340dk_nrf5340_cpuapp), and the extension handles the complex task of passing the correct configuration flags to the build system. - From Code to Flashing in One Click: The core development loop is dramatically simplified. With your application and board selected, a single click on the "Build" button compiles your code. Once successful, you can flash the firmware to your connected development kit using the "Flash" button without ever leaving the VS Code window.
In essence, this combination of SDK and VS Code extension provides the essential starting point for any project. It establishes a stable, powerful, and efficient environment, freeing you from the complexities of toolchain setup and project configuration. It is the command center from which you will launch into the more specialized tasks of hardware configuration, debugging, and testing, which we will explore next.
The Developer's Toolkit: Choosing Your Tools by Task
Now that we have our command center established, it's time to explore the specialized tools you'll pull from your toolkit. A key point to keep in mind for mastering the Nordic ecosystem is that you don’t need to use every tool on every project.
The goal is to select the right tool for the specific job at hand. Let's break this down by common development tasks.
A. For Day-to-Day Coding & Firmware Debugging
The Task: You're deep in the development trenches. Your primary activity is the "inner loop": writing a new piece of application logic, compiling it, flashing it onto your target hardware, and then troubleshooting why it doesn't work exactly as planned. The speed and efficiency of this cycle directly impact your project's timeline more than almost any other factor.
Your Go-To Tools: The integrated Build/Flash buttons, nRF Debug, and Memory Explorer within the nRF Connect for VS Code extension.
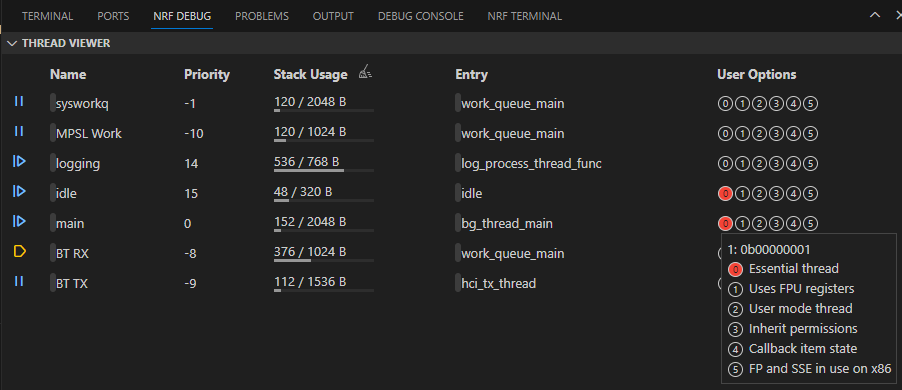
When your firmware doesn't behave as expected, printing log messages can only get you so far. To truly understand what's happening inside the chip, you need a debugger.
The nRF Debug feature is a full-featured, graphical debugger built directly into VS Code, and using it almost feels like a superpower! It allows you to pause the program's execution and inspect its state in detail, providing precise control over the logic flow, a clear view of your application's live data, and a deep understanding of the exact path the code took to reach that point, even across different application threads.
Sometimes
, you need to go even deeper, and for that, the nRF Memory Explorer provides direct access to the device's raw memory, including both RAM and Flash (or any other NVM, such as RRAM in the nRF54L Series). This powerful tool is crucial for solving complex problems, such as finding memory corruption, verifying intricate data structures, or directly inspecting the status of peripheral hardware registers.
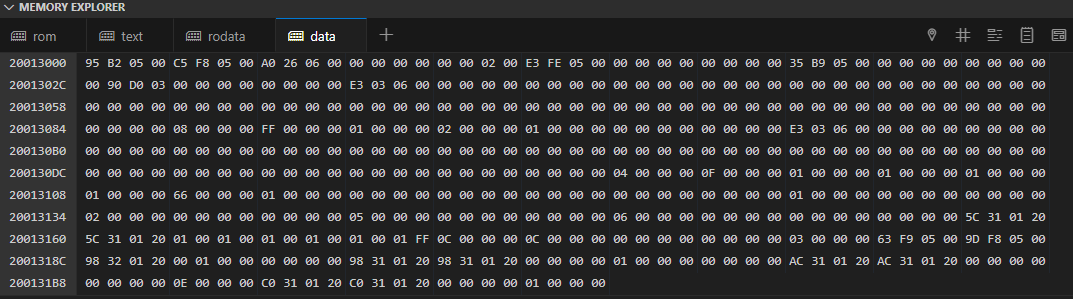
By combining the simple Build/Flash cycle with the powerful inspection capabilities of the Debugger and Memory Explorer, you can create a highly efficient workflow to solve nearly any firmware bug, all from the comfort of a single, unified application.
B. For Initial Setup & Hardware Configuration
The Task: You're kicking off a new project. It’s not on a standard Development Kit (DK); it’s for your own custom hardware. You need to tell the SDK which pins are connected to your LEDs, which I2C bus your accelerometer is on, and that you're using a specific SPI-based display. In a traditional workflow, this means manually editing complex, text-based configuration files, a process notoriously prone to syntax errors and typos that can take hours to debug.
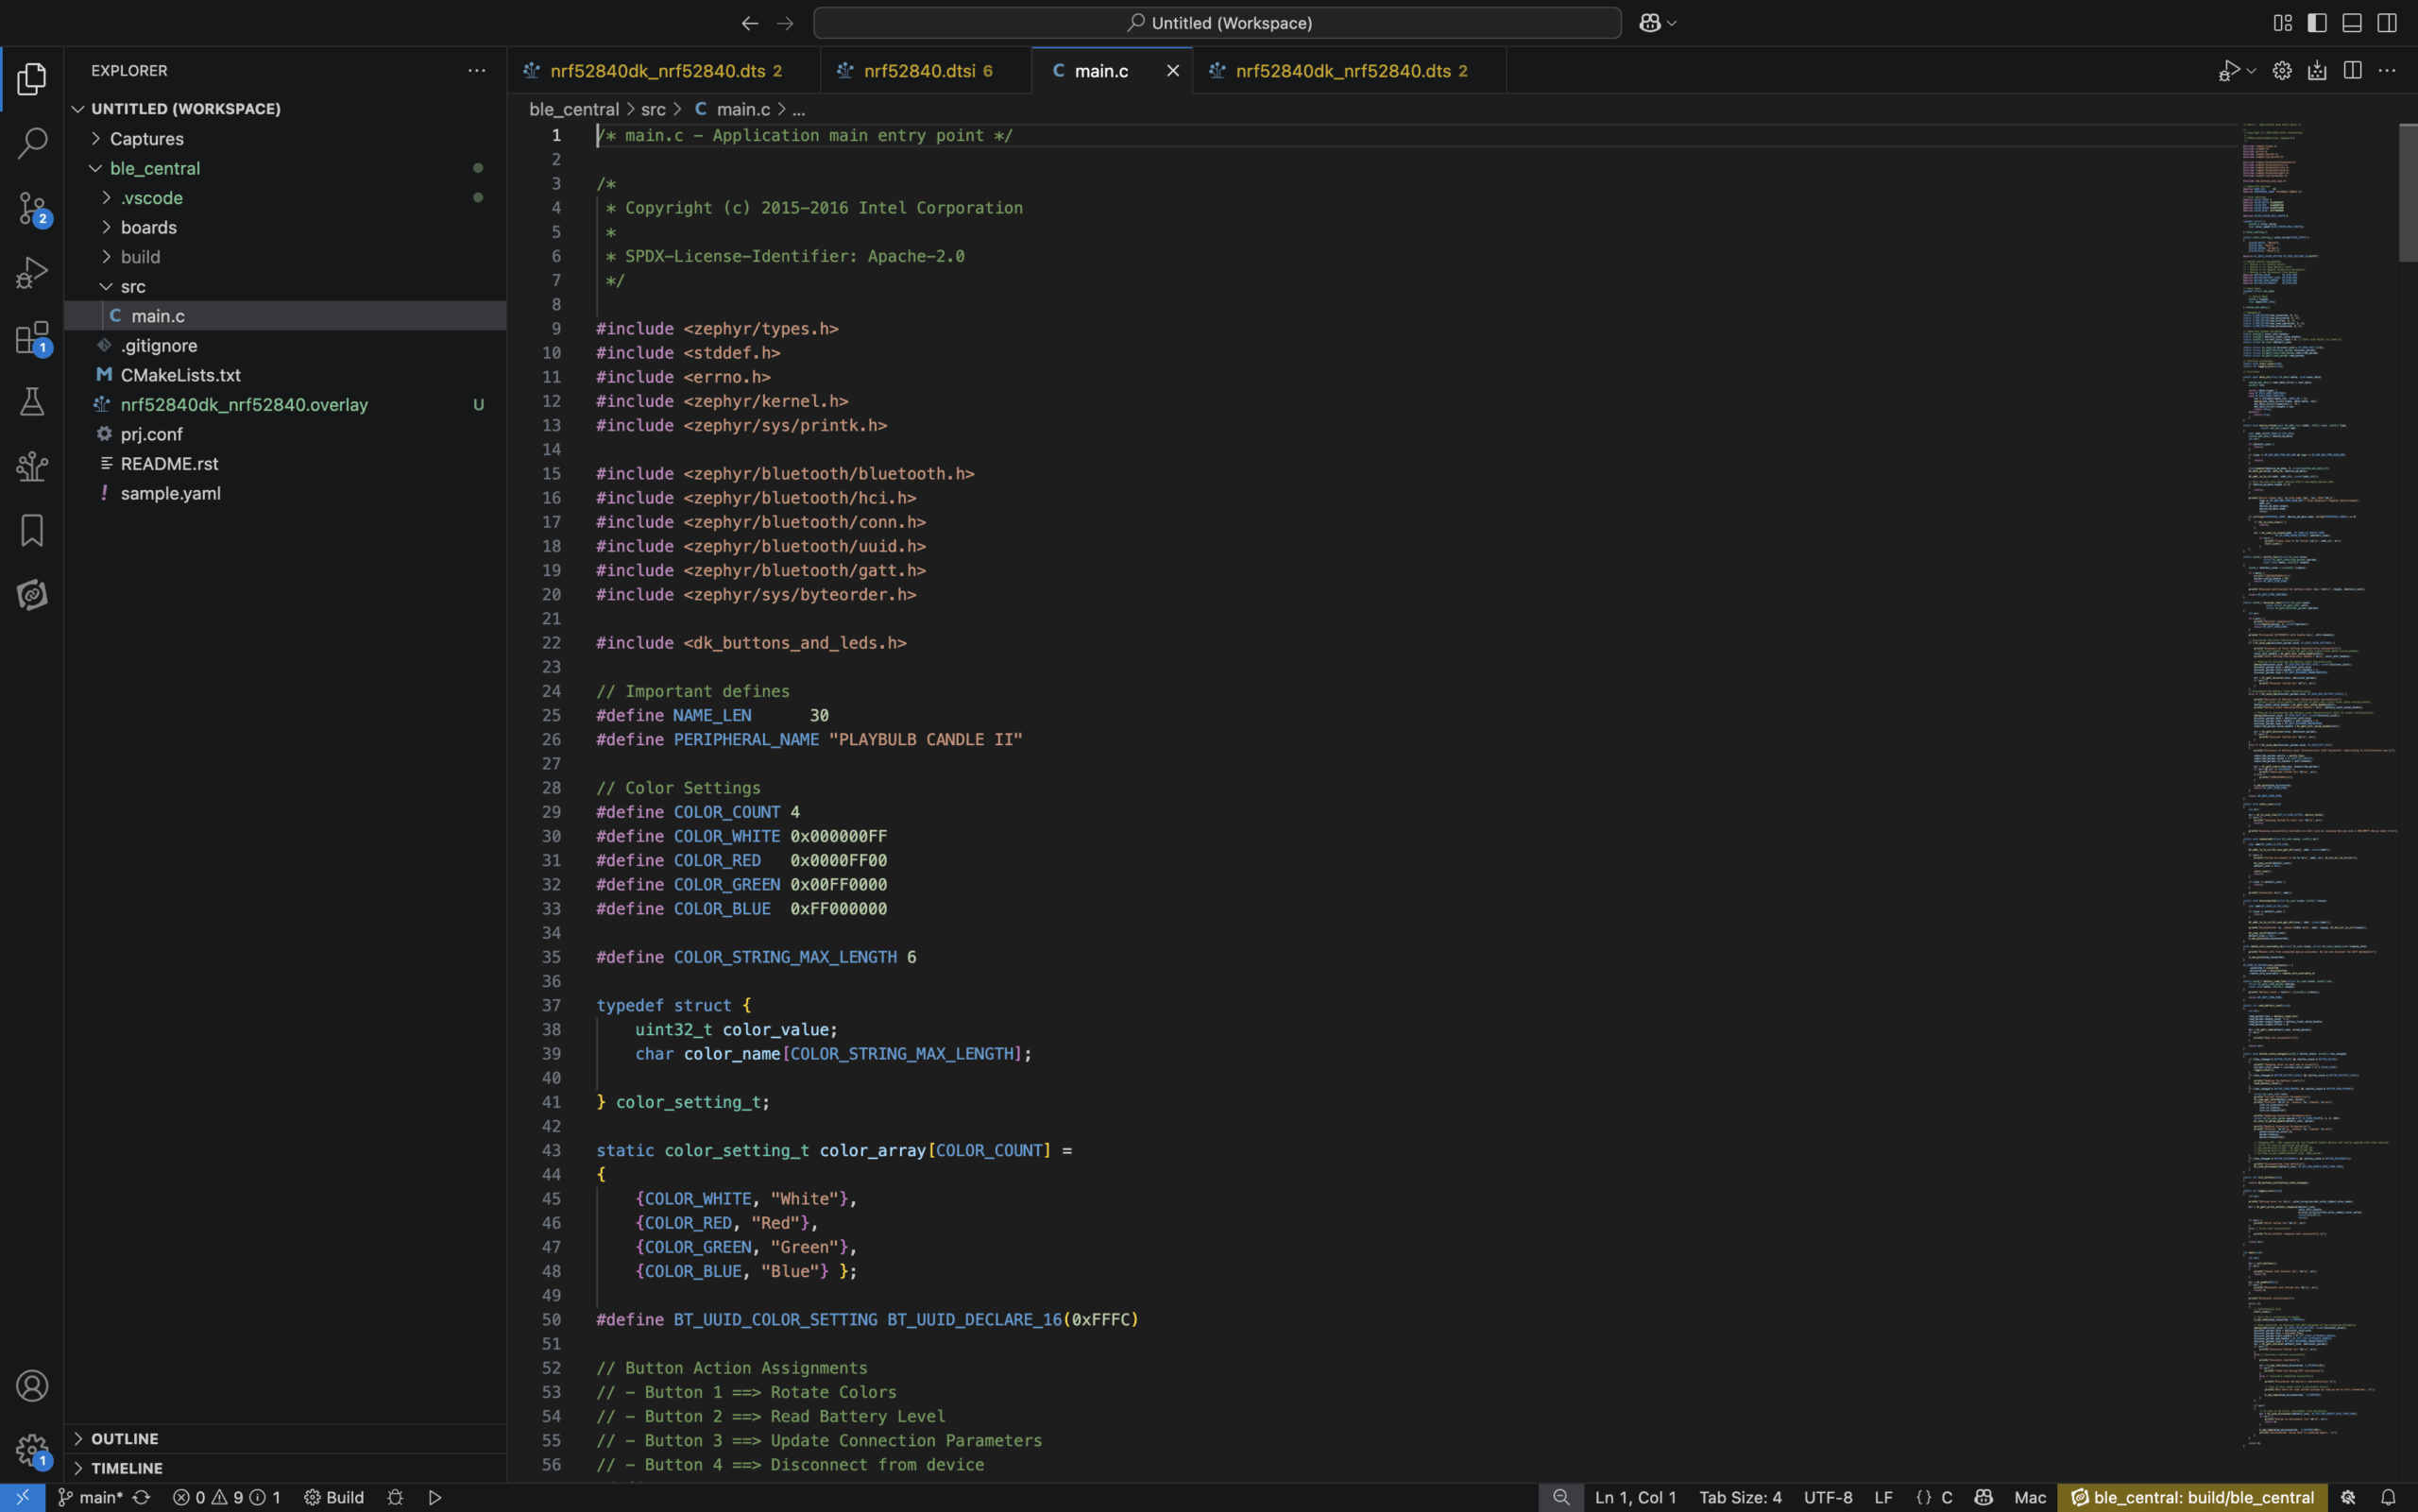
Your Go-To Tool: The Devicetree Visual Editor, integrated directly within the nRF Connect for VS Code extension.
Before diving into the editor itself, it’s important to understand what a "devicetree" is. The nRF Connect SDK, via Zephyr RTOS, utilizes a devicetree to describe the hardware layout of a board in a manner decoupled from the application code. It’s a hierarchical data structure written in special source files (.dts, .dtsi) that represents everything from the CPU cores down to individual GPIO pins and peripheral controllers (such as UART, SPI, and I2C).
The "correct" way to adapt a standard board configuration to your own hardware is by creating an overlay file (.overlay). This file simply specifies your changes and additions, which the build system intelligently "lays over" the base configuration. While this is a powerful and clean system, writing overlays by hand requires precise syntax and a deep understanding of the devicetree structure.
This is where the visual editor changes the game. It parses these files and presents them in an intuitive graphical user interface. Instead of poring over text files, you're presented with a browsable list of all the peripherals available on your selected SoC.
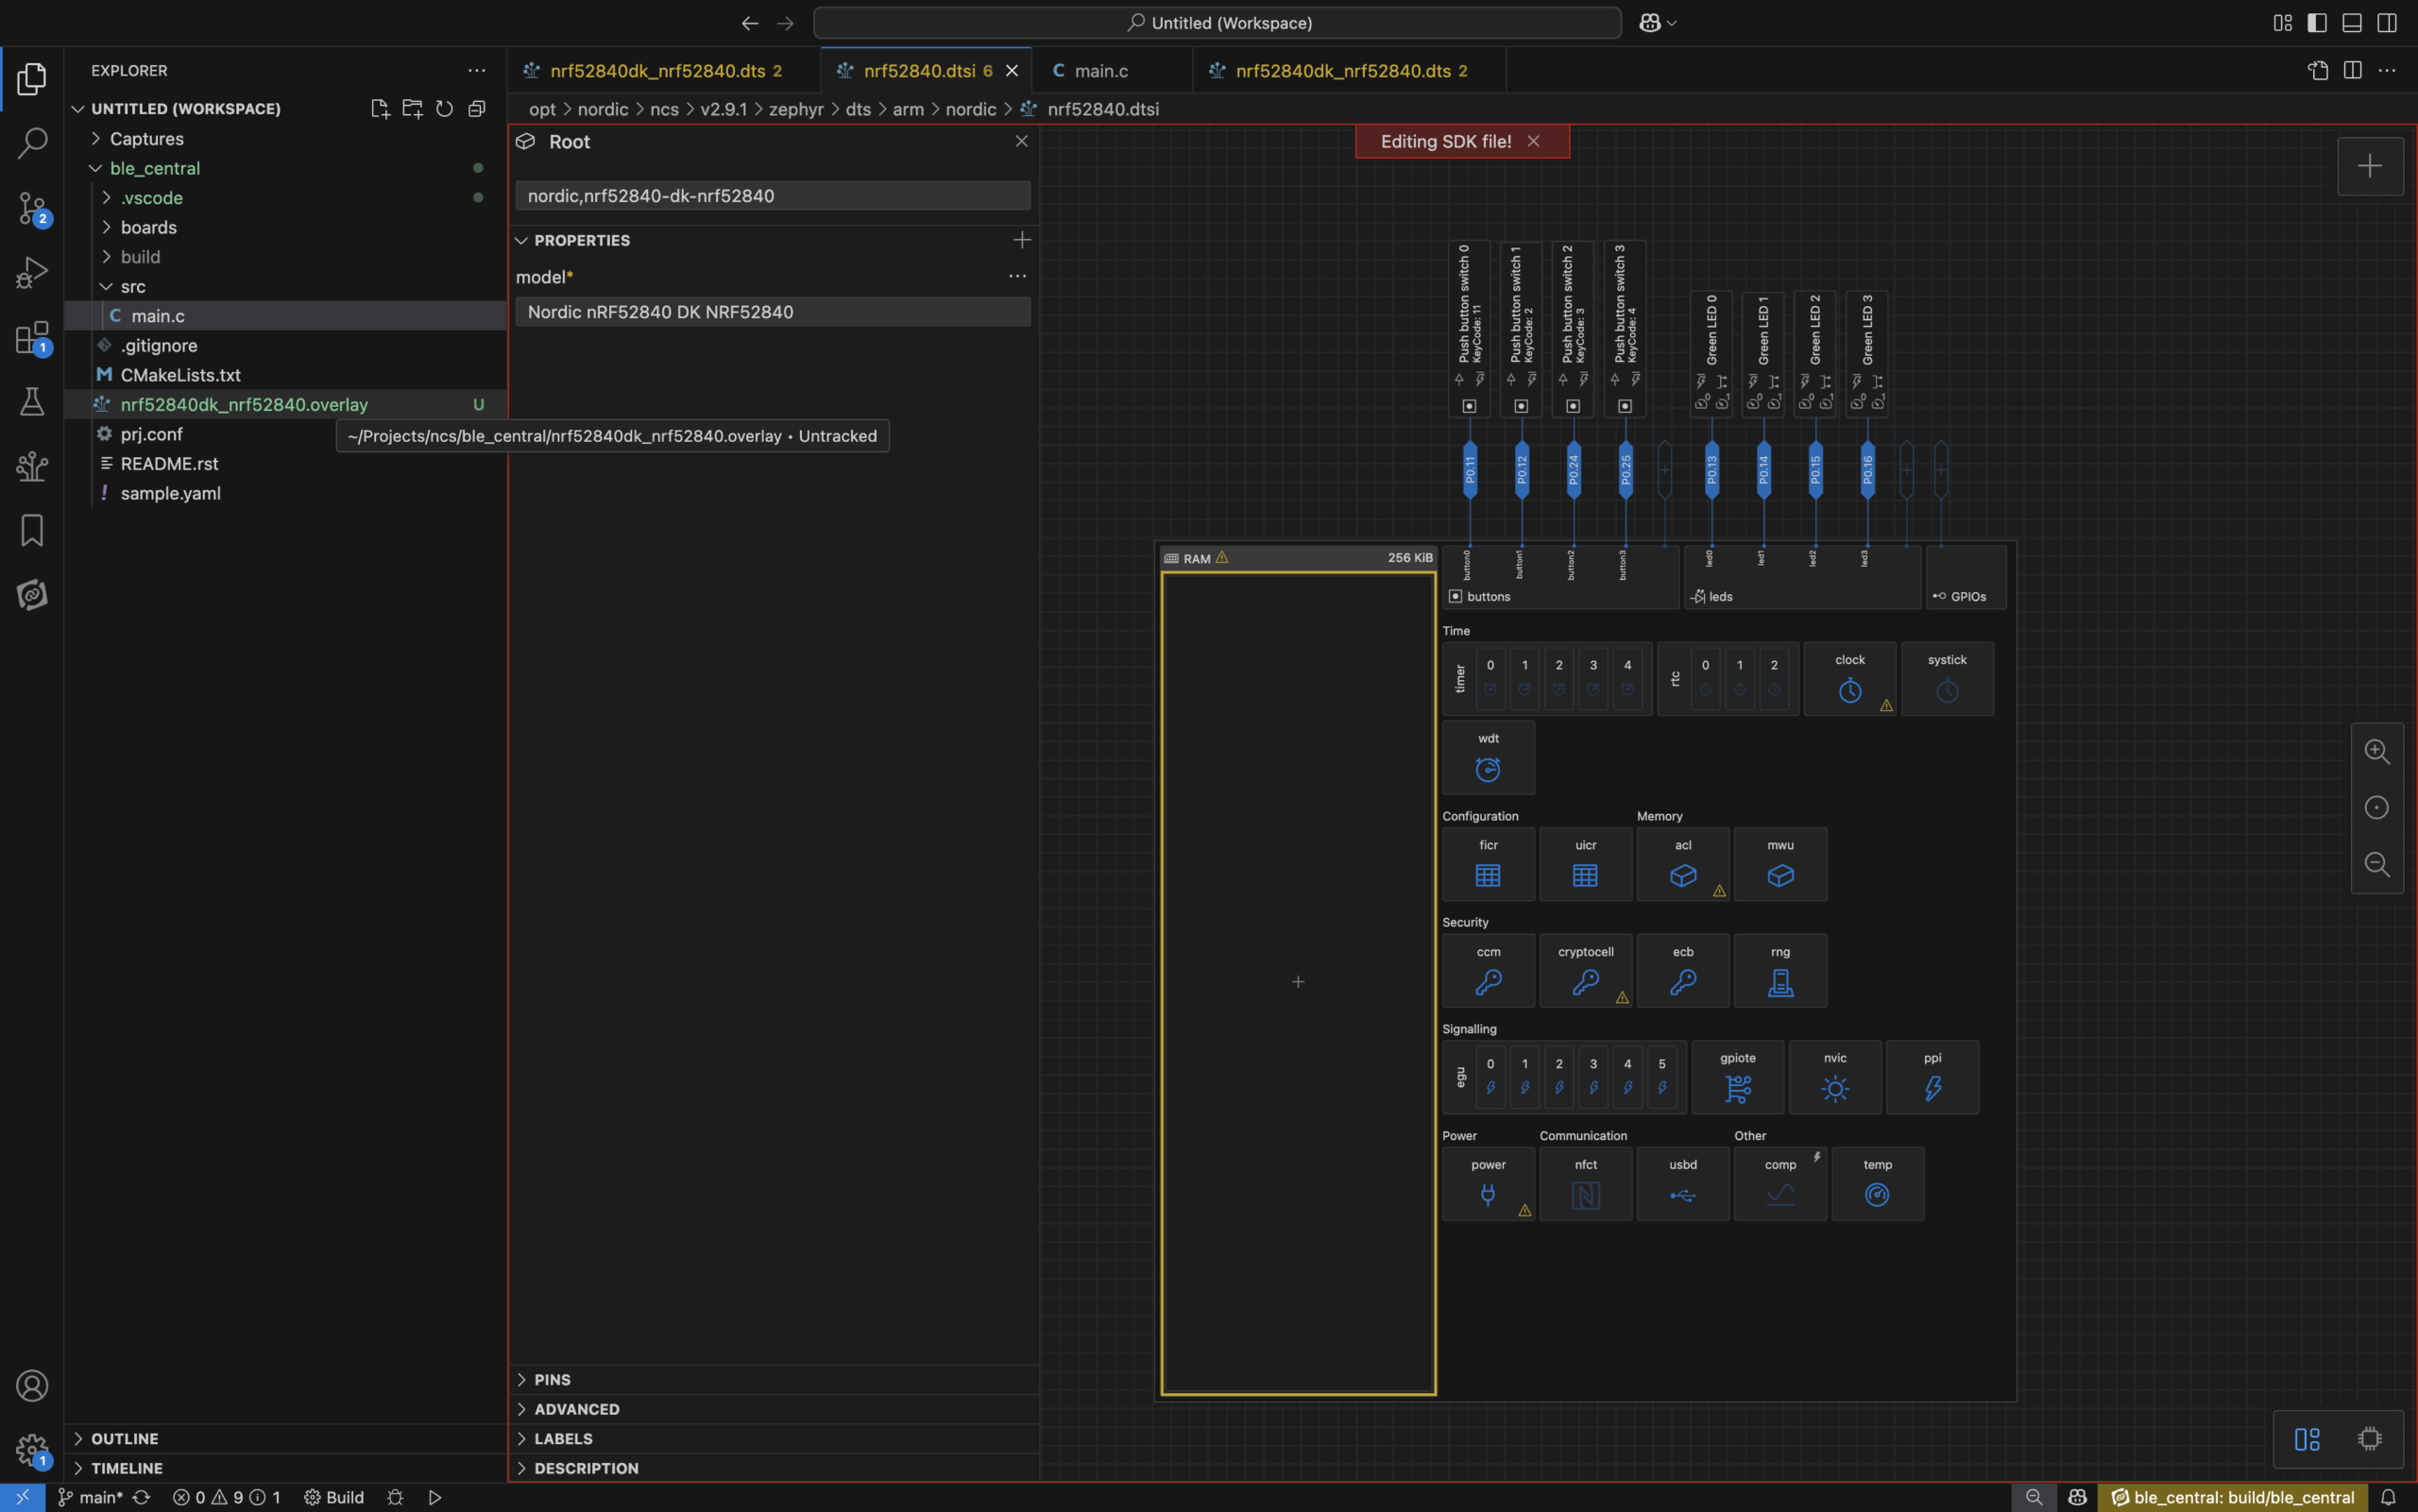
The visual editor abstracts away the complexities of manual text-file editing for hardware configuration. It provides developers with a straightforward and interactive method for understanding and assigning system resources.
C. For RF & Protocol-Level Validation
The Task: Your code compiles, your firmware is flashed, and the device is running. But now you face a new set of critical questions. Is the device actually advertising? Is the signal strength strong enough? When a central device connects, are all the GATT services and characteristics you defined behaving as expected?
Your Go-To Tools: The nRF Connect for Desktop application suite, specifically the Bluetooth Low Energy App and RSSI Viewer app.
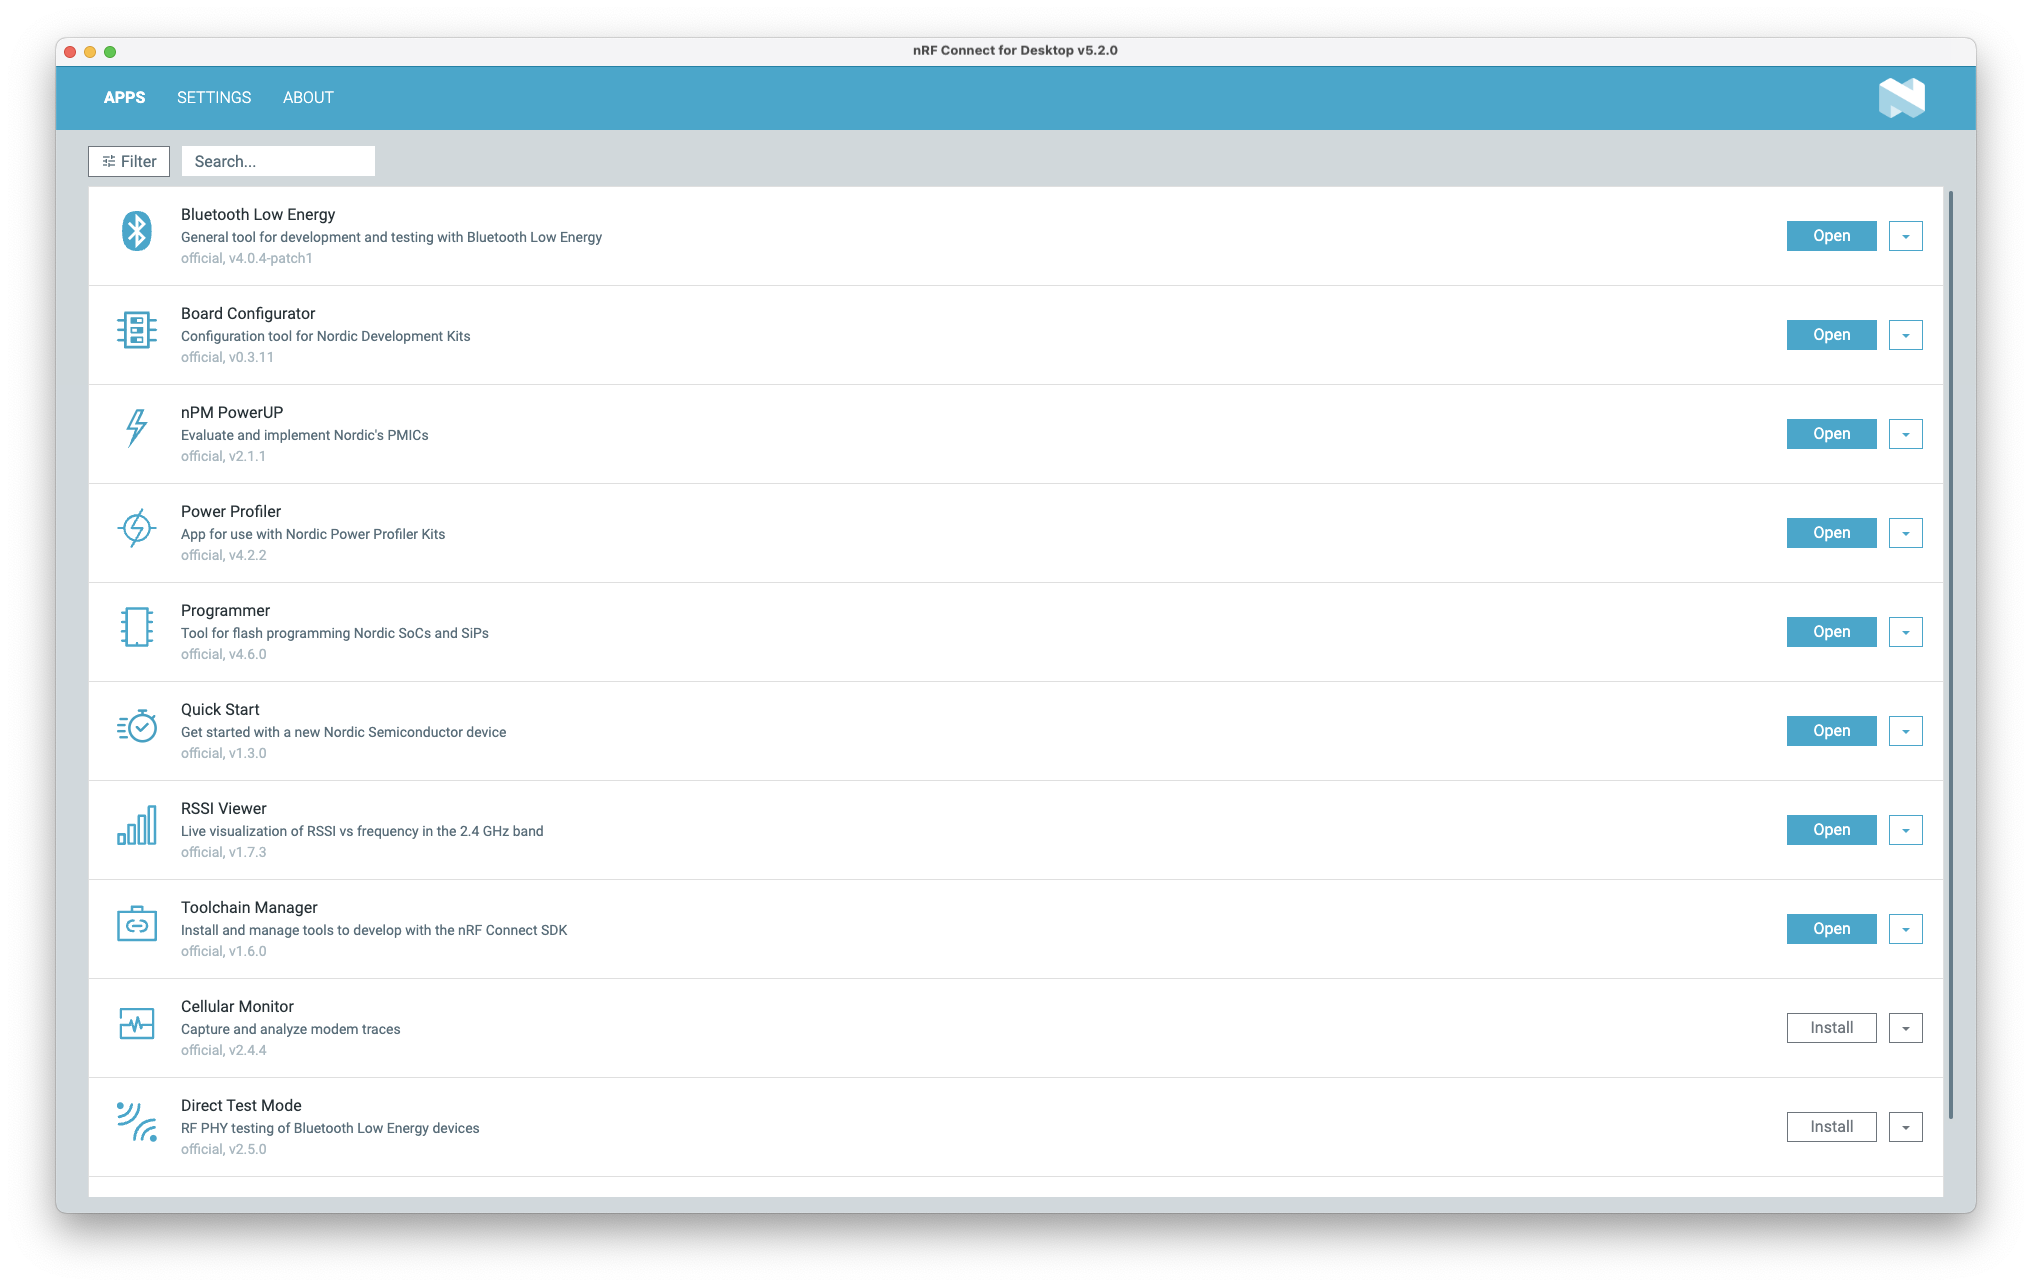
nRF Connect for Desktop acts as your ground-truth window into the wireless world. It uses a Nordic Development Kit (DK) or Dongle connected to your computer as a highly reliable radio interface.
- The Bluetooth Low Energy App: This is the swiss-army knife for BLE protocol testing. It allows you to scan for devices, inspect their raw advertising data, establish a connection, and perform a full GATT service discovery. You can read, write, and subscribe to characteristics to test your device's application logic in a controlled, detailed environment.
- The RSSI Viewer: This specialized tool provides a real-time, graphical plot of signal strength. It's invaluable for comparing antenna performance, validating the effective range of your product, or identifying potential RF interference issues.
- The Direct Test Mode (DTM) App: DTM is a procedure defined by the Bluetooth SIG used for testing the radio's physical layer. Running DTM tests is a mandatory requirement for official Bluetooth qualification. This app provides the graphical interface needed to control a Device Under Test and perform these essential certification tests, demystifying a critical part of the product launch process.
D. For Power Consumption Optimization
The Task: Your device is functionally complete and communicating correctly over Bluetooth LE. But the product requirements demand a two-year battery life from a small coin cell. How can you be certain you are meeting your power budget? How do you find the specific lines of code or hardware peripherals that are consuming precious microamps and preventing your device from hitting its battery life target?
Your Go-To Tools: The Power Profiler Kit II (PPK2) used in conjunction with the Power Profiler app within nRF Connect for Desktop.
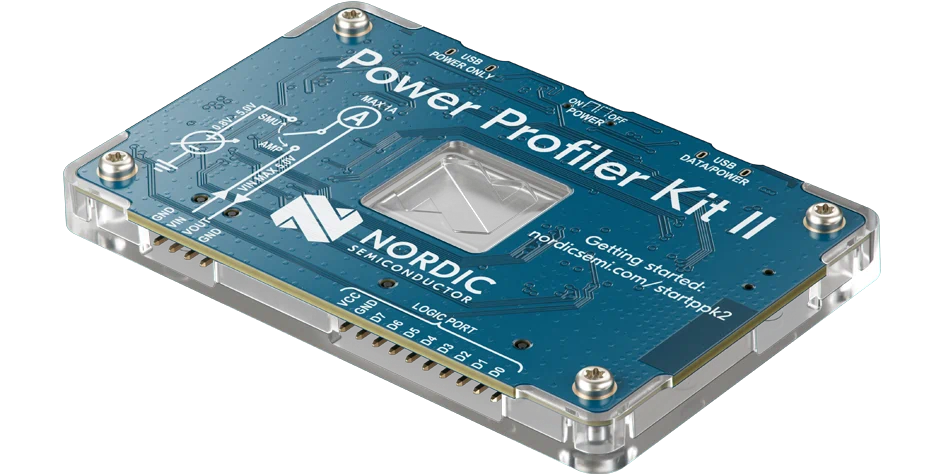
For any low-power application, optimizing firmware is critical. The Power Profiler Kit II (PPK2) is an essential tool for every developer's desk, providing precise current measurements from under a microamp up to 1A. It acts as both the power source for your Device Under Test (DUT) and the high-precision measurement instrument.
Working in tandem with the Power Profiler app, the PPK2 makes it easy to visualize and analyze your design's power usage. In a typical workflow, you'll connect the PPK2 to your computer and use it to power your dev kit or custom board.
Within the app, you can start a capture and immediately see a live graph of the current consumption. Zoom out to see the average current over several minutes, then instantly zoom in on a millisecond-long advertising spike to inspect its characteristics.
By correlating these power consumption peaks with your code's execution, you can quickly identify and fix bugs—like a peripheral left on by mistake—that might otherwise drain your battery and compromise your product's performance in the field.
E. For Mobile Integration & Field Testing
The Task: Your device works perfectly on the bench, but you need to validate its functionality in a real-world setting. How will you update the firmware once it has been deployed? And how do you start building a custom companion mobile app without reinventing the wheel?
Your Go-To Tools: nRF Connect for Mobile and Nordic Semiconductor's open-source Mobile App Libraries & Examples on GitHub.
- nRF Connect for Mobile: Available for both Android and iOS, this is your untethered field-ready toolkit. It provides the same core GATT client functionality as the desktop app but adds the killer feature for any real-world product: Over-the-Air Device Firmware Update (OTA DFU). You can test your entire DFU process—from generating the firmware package to securely transferring and activating it on your device—using this reliable, off-the-shelf tool.
- Open-Source App Accelerators: When you're ready to build your own branded app, don't start from scratch. Nordic provides high-quality example apps like nRF Blinky and the more comprehensive nRF Toolbox. More importantly, these apps are built on robust, reusable libraries (e.g.,
Android-BLE-Library) that handle the complexities of mobile Bluetooth communication. By including these libraries in your own project, your mobile developers can save weeks or months of effort and focus on the UI and application logic, not on debugging low-level BLE state machines.
The Unified Advantage: How It All Works Together
The most profound accelerator in the Nordic ecosystem is that these instruments aren't isolated; they are part of a single, cohesive toolchain where the whole is far greater than the sum of its parts.
Consider a common workflow:
- You start in VS Code, using the Devicetree Visual Editor to configure your I2C pins.
- You write your sensor driver code and use the nRF Debugger to step through the logic and fix a byte-swapping issue.
- With the firmware running, you open nRF Connect for Desktop.
- First, you use the Power Profiler to find and fix a high-current issue caused by leaving the sensor on.
- Then you switch to the Bluetooth Low Energy App to validate that your custom GATT service is reporting the correct sensor data.
- Finally, you take the device into the field, using nRF Connect for Mobile to test its range and perform a full OTA DFU to prove its serviceability.
This seamless flow—from visual hardware configuration, to deep code-level debugging, to power profiling, to protocol validation, and finally to field testing—is the unified advantage in action. Each tool hands off to the next, allowing you to move with confidence and speed.
Developer Enablement: Documentation, Community, and Support
Great tools are only one part of the equation. Nordic provides a multi-layered support structure to ensure you have a path forward when you encounter a roadblock.
- Guided Learning (Nordic DevAcademy): A free, online learning platform with structured courses and hands-on exercises to guide you from fundamental concepts to advanced topics.
- Definitive Answers (Official Documentation): The comprehensive library for every technical detail, from hardware specifications to SDK API references.
- Community Collaboration (The DevZone Forum): An incredibly active technical forum and knowledge base where you can find answers from thousands of developers and Nordic’s own application engineers.
- Direct, Professional Support (Nordic Ticketing System): A confidential ticketing system for commercial customers to get private, one-on-one assistance from a Nordic engineer for project-halting issues.
- Built-in AI Chatbot (TechDocs AI Assistant): An interactive tool that allows you to describe what documentation you're looking for in simple language.
Final Thoughts: Develop Smarter, Not Harder
The journey from a product concept to a market-ready connected device is complex, but it doesn't have to be frustrating. The key to mastering the Nordic ecosystem isn't about knowing every tool, but about learning how to choose the right tool for the job.
It’s about knowing which tool to grab to solve a specific problem efficiently. The true, compounding advantage comes from their seamless integration, which eliminates friction and empowers you to innovate faster. By providing a robust and unified toolchain, Nordic handles the complexity, allowing you to focus your valuable time and energy on what you do best: building the unique features that make your product stand out.
Ready to start your journey?
- Get started with Guided Learning: Enroll in a free course at the Nordic DevAcademy.
- Install the "Command Center": Download and install the nRF Connect SDK and the nRF Connect for VS Code Extension.
- Explore the Community: When you have questions, search for answers or ask the community on the DevZone Forum.
- Leverage Open Source: Explore the mobile app accelerators and other projects on Nordic Semiconductor's GitHub.
- Reference the TechDocs: The TechDocs website from Nordic provides you with all the documentation you need to learn how to use even the most specific parts of the SDK.
- Interact with the AI Chatbot: Quickly find answers to your specific questions in the documentation by using the built-in AI Assistant.


