PowerScope
A power-profiling extension for VS Code that turns a bare current trace into a ranked, per-event power breakdown. Same shift a CPU profiler made for performance debugging, now for battery life.
Get Notified When It Ships
Enter your email and I'll let you know the moment PowerScope is available. No spam before then, no spam after.
You're on the list!
I'll email the moment PowerScope ships.
No spam. Unsubscribe anytime.
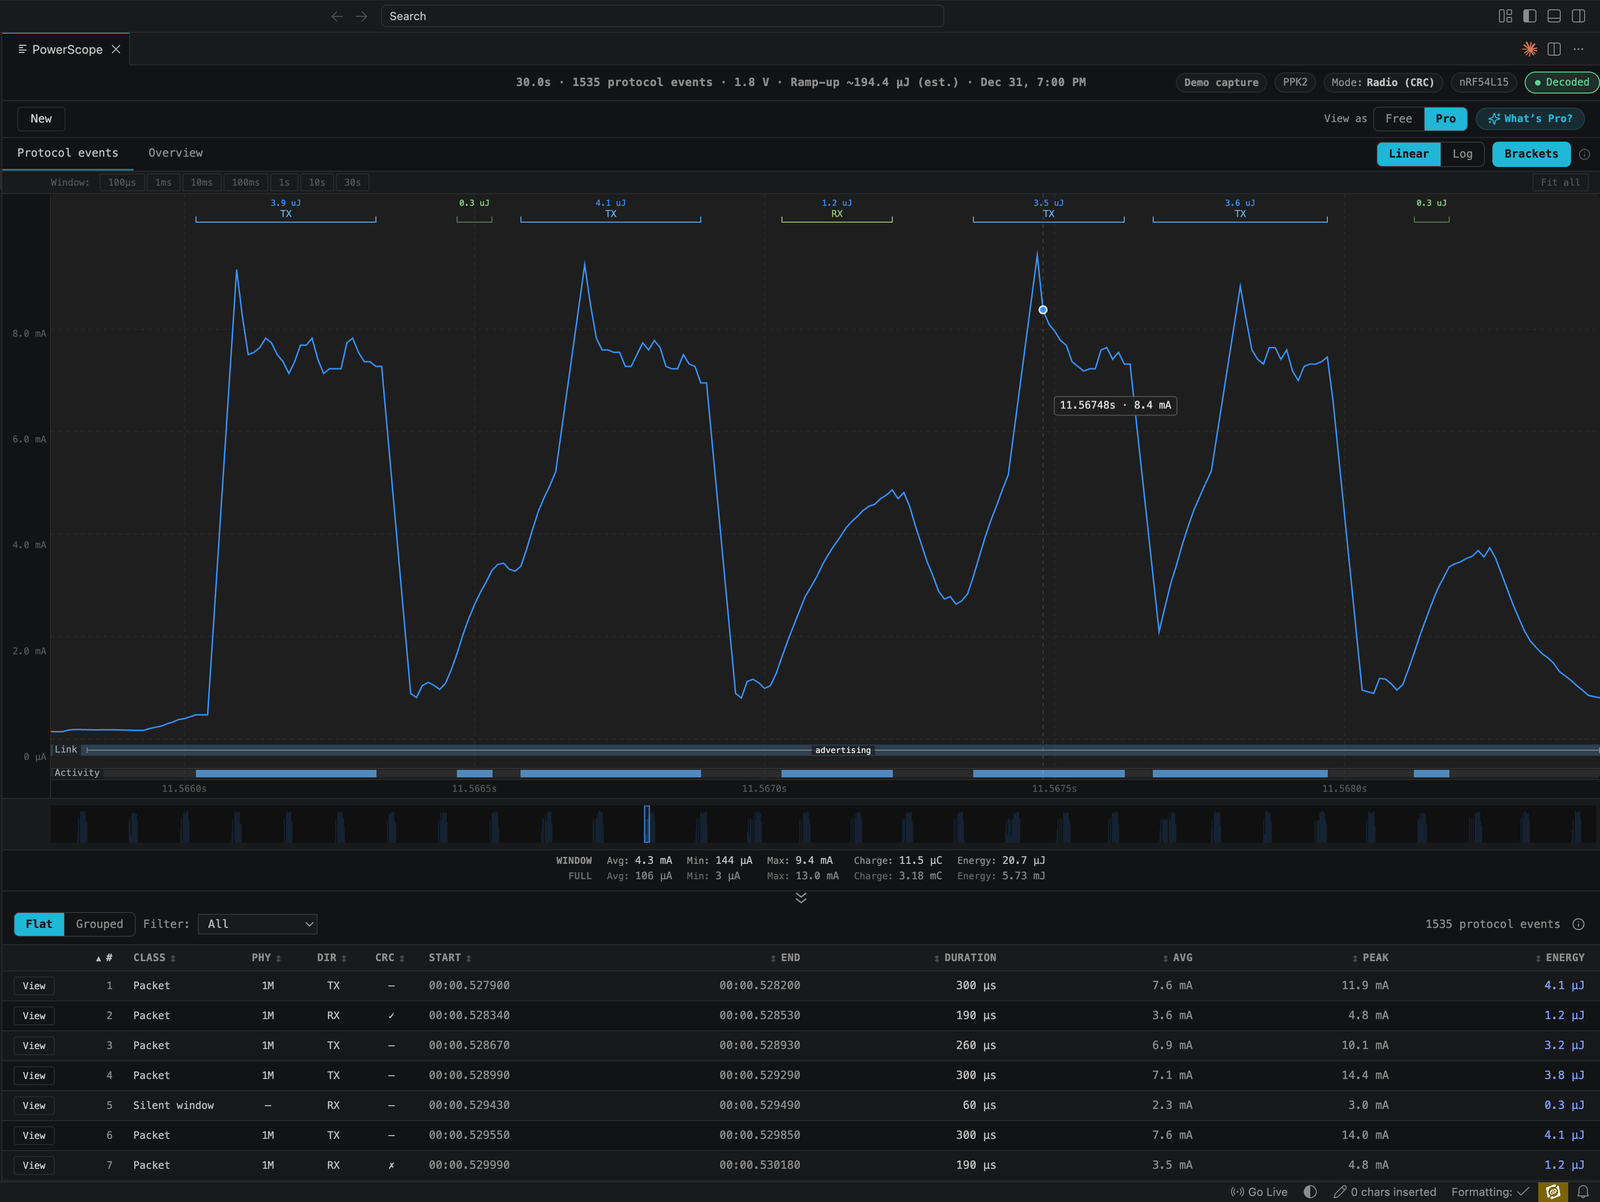
An early build, running the bundled demo capture
What PowerScope Will Do
Turns power debugging into profiling, not guessing
A raw current trace can't tell you which advertising or connection event caused a spike, so most teams eyeball an average and call it done. PowerScope decodes what your radio was doing and stamps it onto the trace automatically — TX, connection events, retries, sleep — so you get a ranked breakdown of where your power budget actually goes.
Catches what averages hide
A fuel-gauge percentage or an average current reading can't show that one event type spikes hard above baseline — the kind of thing that quietly drains a coin cell to brown-out at end-of-life while the average still looks fine. PowerScope's per-event breakdown makes that event visible at the bench, before it's a field complaint.
- Captures power with the Nordic PPK2 or a Joulescope — no new hardware to buy
- Runs inside VS Code, where you already write firmware