

Somewhere in your coin-cell product’s firmware, the device reads its own battery and reports a level: a percentage over the Bluetooth LE Battery Service, a bar in an app, a number on your fleet dashboard. The number looks fine. Then units in the field start resetting, and the battery telemetry never warned you.
I’ve found that this catches a lot of teams off guard, and it is not a firmware bug. The level your device reports is measured at rest, and the failure happens under load. Worse, battery percentage is answering the wrong question. It estimates how much energy is left in the cell. Your Bluetooth LE device doesn’t brown out when it runs low on energy. It browns out when the voltage sags too far during a transmit, and that is a different thing entirely.
Let me walk through what your battery percentage actually measures, why it is blind to the failure that takes your device down, what the real cutoff looks like on the bench, and what you can do about it.
What your battery percentage actually measures
Start with how that number gets made. Most coin-cell devices don’t have a dedicated fuel-gauge chip; it costs money and board space they don’t have. Instead the firmware reads the supply voltage through the SoC’s ADC (directly, or through a resistor divider) and maps that voltage to a percentage using a discharge curve. That percentage is what gets reported, often as a 0 to 100% Battery Level over the Bluetooth LE Battery Service, or pushed to your cloud as battery telemetry.
Two things about that measurement decide everything that follows.
First, it is a voltage reading taken at rest. The ADC conversion is a brief, low-current sample, and firmware almost always takes it between radio events, not in the middle of a transmit. So the reported number is built from the resting voltage, the same value a multimeter on the bench would show, and it never sees the dip that happens under load.
Second, that percentage tracks the wrong physical quantity. It estimates energy remaining, and energy remaining is not what fails first. Your device browns out when the voltage sags under a current pulse, and how far it sags is set by the cell’s resistance, a separate property from its remaining charge. So even a more capable gauge that counts charge in and out (a coulomb counter, the kind you find in a phone and rarely on a coin cell) tracks energy more accurately and still misses the loaded-voltage margin that decides whether the next transmit browns out the chip.
So whether your reported percentage is crude or precise, it is blind to the failure mode that takes the device down. To see why, let’s look at what the cell does under load.
A coin cell is not a fuel tank
The reason that resting reading misleads you sits in the battery itself. The intuition that gets people into trouble, the same one behind both a “2-year battery life” estimate and a battery-percentage gauge, treats the cell like a fuel tank: it holds X amount of energy, you burn it at some rate, and the device runs until the tank hits empty.
A real battery doesn’t behave that way. A more accurate model is an ideal voltage source in series with a resistor, called the internal resistance (ESR) of the cell (you’ll also see it written as internal resistance or R_int; Qoitech and capacitor datasheets tend to use “ESR,” for equivalent series resistance). The voltage you actually see at the terminals is:
V_terminal = OCV − (I × ESR)where OCV is the open-circuit voltage (the voltage with no load) and I is the current you’re drawing. This is the standard Thevenin model of a cell, and it has two consequences that matter a lot for coin cells.
First, the voltage measured with no load is the OCV. On a coin cell the OCV holds up well for most of the discharge and sags only gradually, and even deep into the cell’s life it stays above the chip’s minimum operating voltage. That is exactly the voltage your at-rest ADC sample reads, and it is why a resting reading almost always looks survivable, right up until the device stops working.
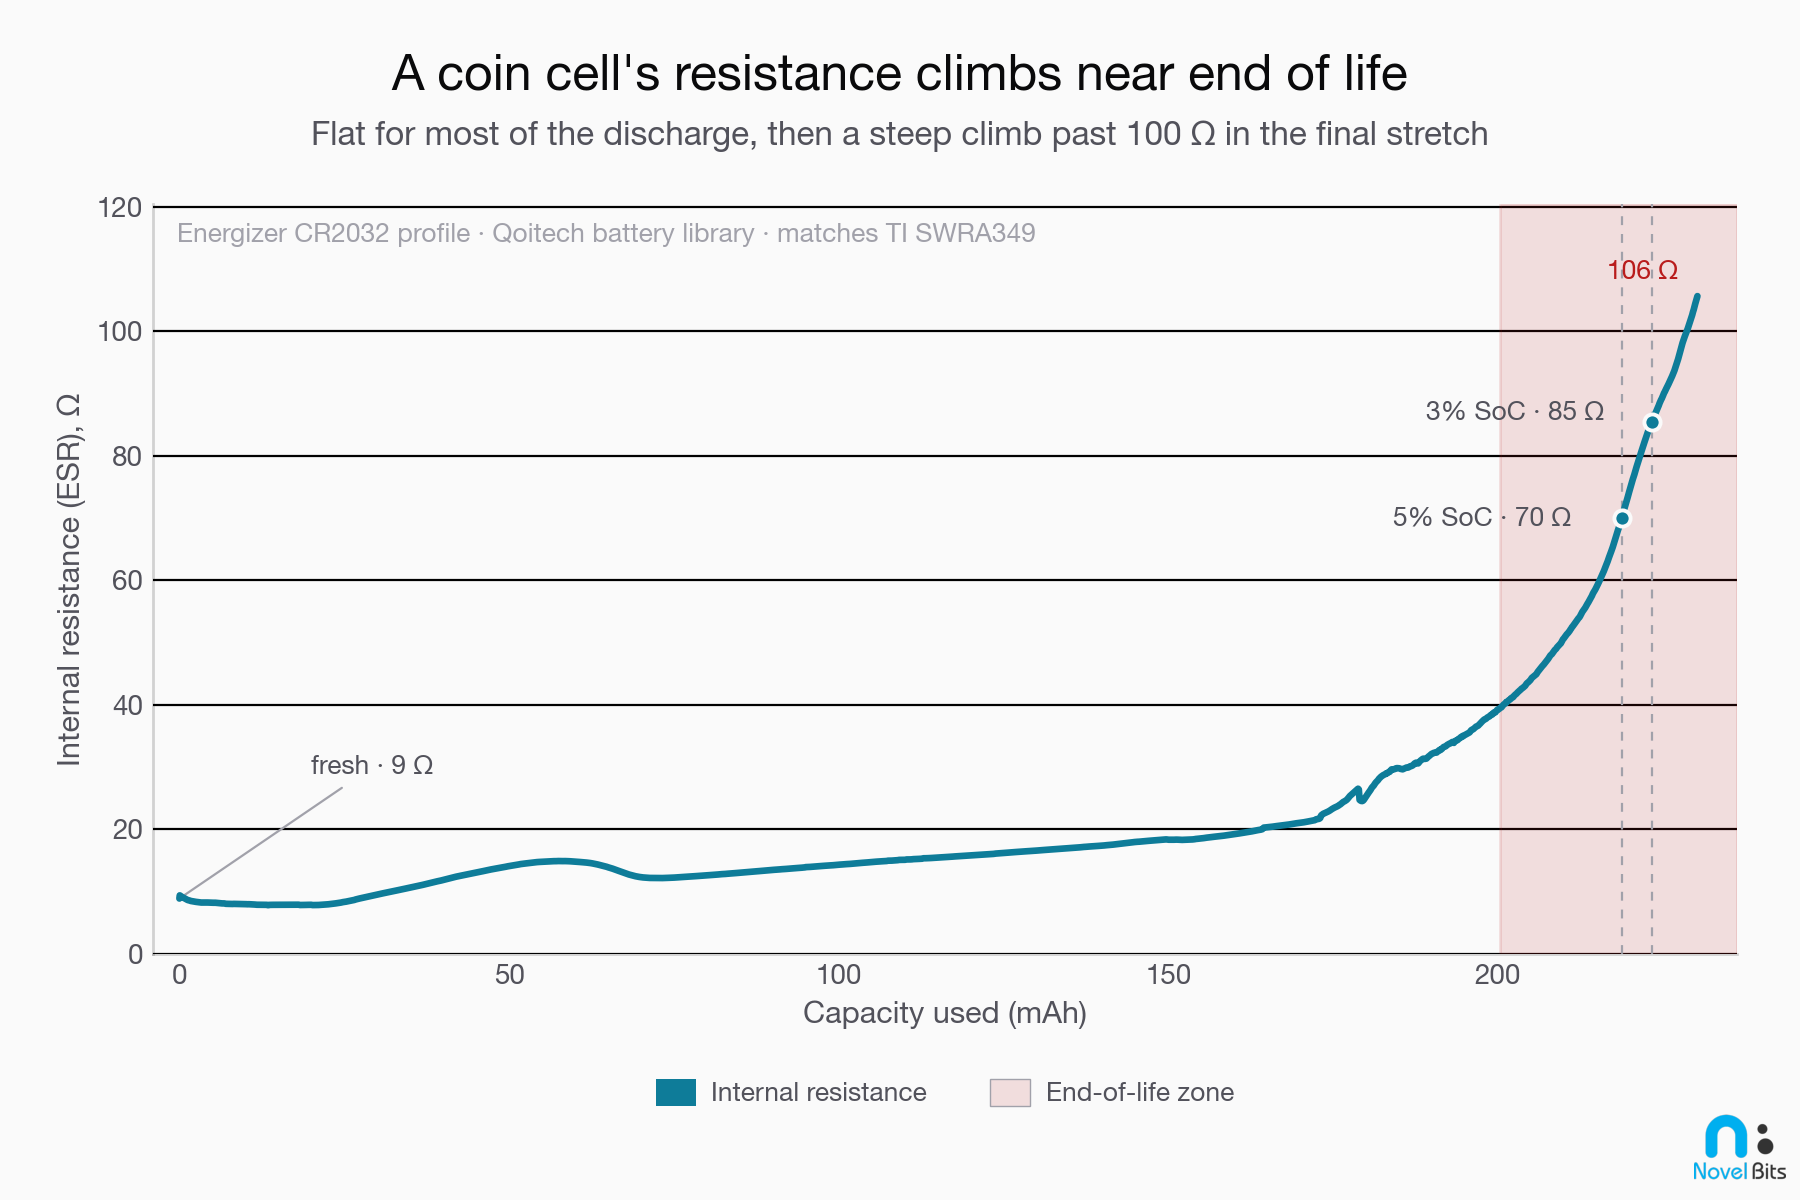
Second, the term that actually bites is I × ESR, and
the ESR is not constant. A fresh CR2032 has an internal
resistance on the order of 10 Ω (Energizer’s datasheet plots it as a
curve that starts around 5 to 15 Ω, not a single spec). As the cell
discharges, that resistance climbs, and near end of life it climbs
steeply. TI measured this climb directly in their coin-cell
application note (SWRA349): the internal resistance sits in the 10
to 15 Ω range through mid-life, then spikes past 45 Ω toward end of
life. The stock Energizer CR2032 profile I used on the bench carries
that same curve further still, climbing past 100 Ω as the last of the
capacity is used (it’s the curve plotted just below).
So as the cell ages, every milliamp you draw costs more and more voltage. The OCV (what your gauge reads) looks fine. The loaded voltage (what the chip sees) is quietly collapsing.
Bluetooth LE is close to the worst-case load
Bluetooth LE makes this problem sharper. It was designed to sip power by sleeping most of the time and waking for very short bursts to transmit or receive. That’s great for average current. It’s rough on a high-resistance cell.
The reason: the cell doesn’t care about your average current during those bursts. It sees a short, tall current pulse. On an efficient part like the Nordic nRF54L15, a 1 Mbps (LE 1M PHY) transmit at 0 dBm draws roughly 4 to 5 mA of total current at 3 V (Nordic’s system figure; the radio block alone is about 3.7 mA in the datasheet). On top of that, the on-chip DC/DC converter recharges its input in brief, higher current bursts, so the current drawn at the chip during a wake is spikier than the average suggests. On a real board, though, the fastest of those spikes come from the DC/DC converter switching, and the board’s decoupling capacitors supply them, not the cell. What the cell actually delivers is the smoother average of the transmit burst, and it’s that burst current, sustained over a few hundred microseconds to a couple of milliseconds, that sags a high-resistance cell.
Now multiply that pulse by a rising internal resistance. A burst that was a non-event when the cell was fresh (a few milliamps across 10 Ω is a few tens of millivolts of droop) becomes a cliff when the same burst hits 100 Ω late in life.
A quick illustrative example (round numbers; we’ll confirm them on the bench below):
- Suppose late in life the internal resistance has climbed to about 90 Ω.
- A transmit burst pulls a 15 mA pulse (the radio draw plus the converter’s input current during the burst, which runs above the 4 to 5 mA quoted earlier because a buck converter draws more input current as the rail sags toward end of life).
- The droop during that pulse is 15 mA × 90 Ω = 1.35 V.
- Starting from a resting 2.3 V, the rail the chip actually sees during the burst is 2.3 − 1.35 = about 0.95 V.
That 0.95 V is the number that decides whether your device lives. And it shows up only during the burst, for a few hundred microseconds, which is exactly the moment your at-rest battery reading skips over.
The cliff: where the chip gives up
Every Bluetooth LE chip has a voltage floor, and crossing it briefly is enough to take the device down. For the Nordic nRF54L15, the numbers (from the datasheet) are:
- Operating supply range: 1.7 V to 3.6 V.
- Brown-out reset (while running): the chip resets when VDD falls into roughly the 1.57 V to 1.64 V band (specified as a range, not a single value).
- Clean power-on restart: needs about 1.75 V at VDD.
- Power-fail comparator (POF): a configurable early-warning threshold you can set anywhere from 1.7 V to 3.2 V in 100 mV steps.
Let’s put the two halves together. The illustrative 0.95 V burst-time rail from the last section is well under the 1.57 to 1.64 V brown-out band. The chip resets. When it tries to come back up, it needs 1.75 V to restart cleanly, but the next transmit burst drags it down again. You get a device that boots, transmits, browns out, and reboots, over and over, while its own battery reading, taken at rest, still reports a voltage well above the 1.7 V floor.
One more useful detail: the nRF54L15 runs the whole radio off a single VDD rail (1.7 to 3.6 V) with a single-inductor DC/DC converter, and there’s no separate higher-voltage requirement for higher transmit power. So the failure here is purely the loaded-voltage droop, not a “you need more volts for more dBm” effect.
What this looks like on the bench
That is the arithmetic. Here is the same failure on real silicon.
I built a rig that swaps the coin cell for two instruments: one that can fake a depleting cell, and one that can watch the rail sag under load.
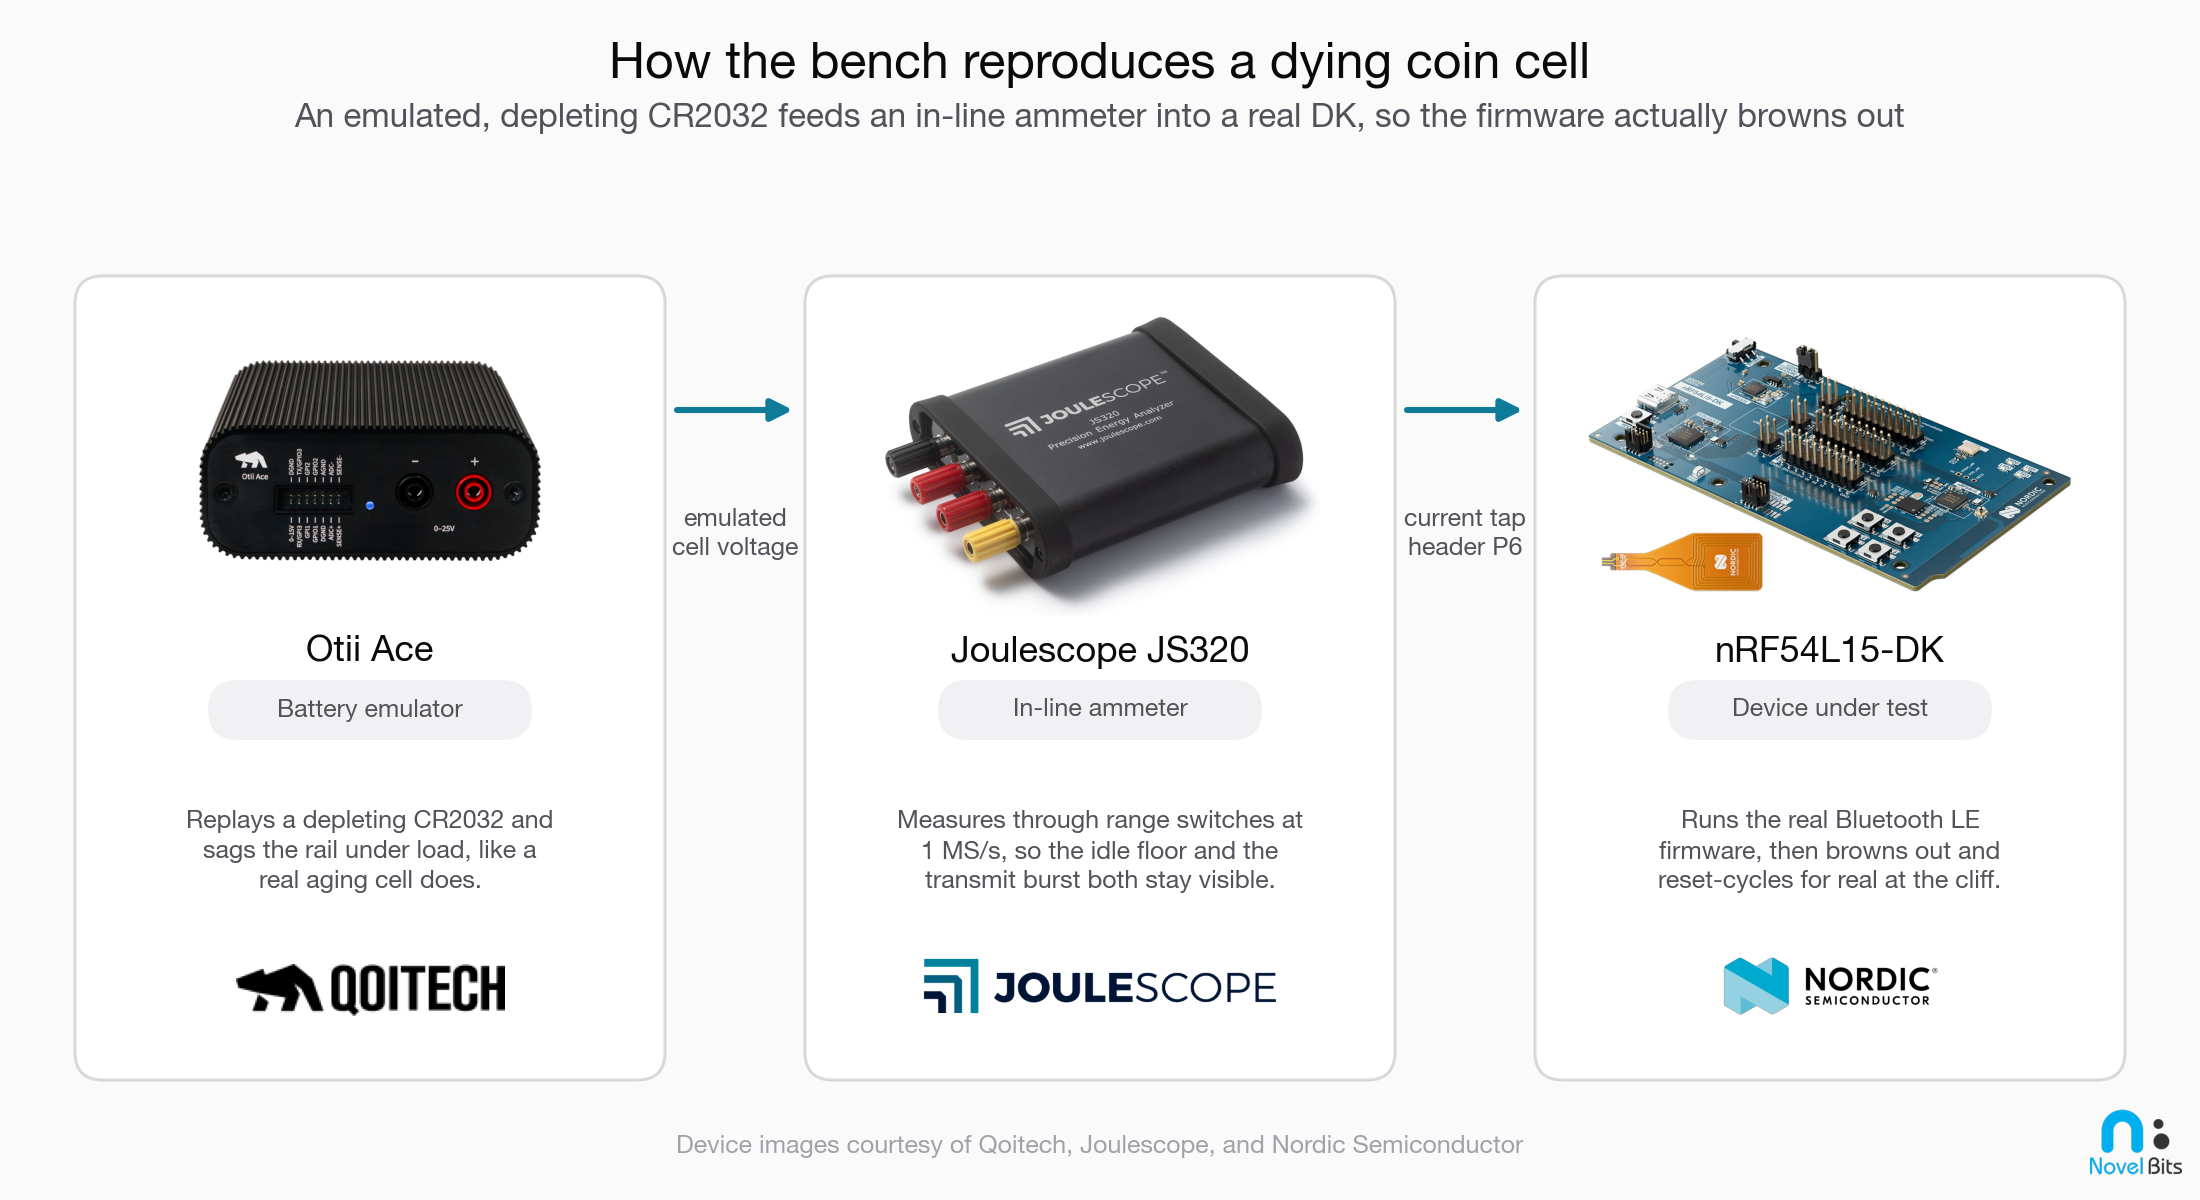
The battery emulator is the piece that makes this honest. Per Qoitech, the “Otii Battery Toolbox emulates the total ESR,” and it “will adjust the output voltage depending on the load, just like a real battery with internal resistance.” So it can hold a chosen state of charge and sag the rail under load the way an aging cell would, which a bench power supply (a stiff, ideal source) simply cannot do. A lab supply would happily hold a perfect rail, and you would never see the failure.
One caveat on reading the traces that follow: the millisecond-scale sag is the emulator faithfully doing its job, reproducing the cell’s rising end-of-life resistance under load. The finer sub-millisecond wiggles are the emulator’s own regulation and the test leads, not real cell behavior, so read the envelope, not the fuzz.
The ammeter matters, too, though for a subtler reason than raw speed. The current signal lives in two places at once: a sleep current down in the microamps, and a transmit burst up in the milliamps. A meter that autoranges between those two worlds, or that averages over a slow window, smears the burst into a number that looks harmless, so I used a Joulescope JS320, which reads at its set range straight through the range switches and keeps the microamp floor and the milliamp pulse in one trace.
One clarification is worth making, because it is easy to get wrong: the brown-out itself is a voltage event, and a relatively slow one. The sag that trips the chip plays out over hundreds of microseconds to a couple of milliseconds, set by the average current of the transmit burst against the cell’s resistance, so a modest sample rate captures it perfectly well. The very fastest current spikes, the sub-microsecond ones from the DC/DC converter, are absorbed by the board’s decoupling capacitors and never reach the cell. So the high-speed current trace is not what reveals the brown-out. The rail voltage is, and you can see that sag without a fast meter.
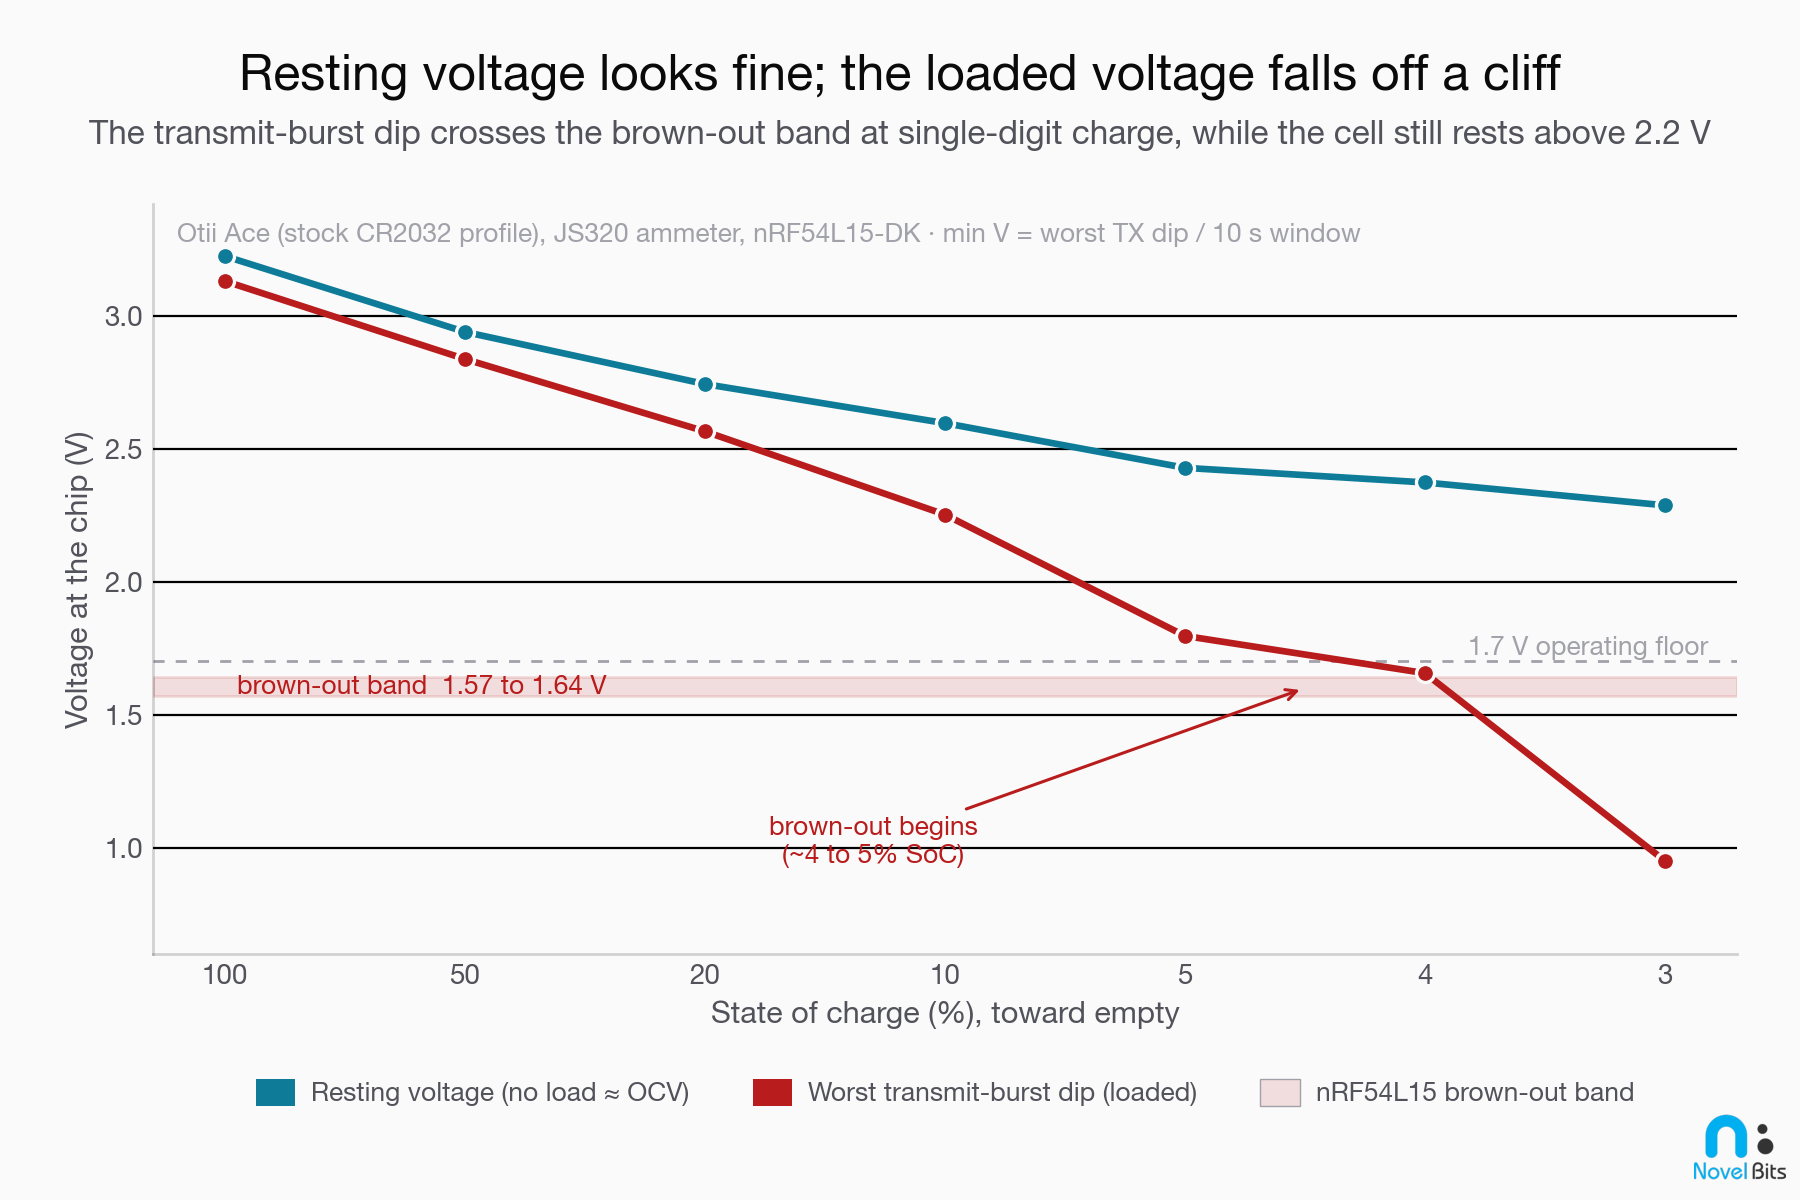
Then I swept the emulated state of charge from full down toward empty and watched two voltages at once: the resting voltage (what your battery gauge would read) and the worst transmit-time dip (what the chip actually sees):
- 100%, 50%, 20% state of charge: clean. The device advertised normally and the worst transmit-time dips stayed well above the floor (3.13 V, 2.84 V, 2.57 V respectively).
- About 10%: still clean, but the margin is shrinking: the cell rests at 2.60 V and the worst dip is down to 2.25 V.
- About 5%, the edge: the cell rests at 2.43 V, comfortably above the 1.7 V minimum, so an at-rest reading says fine. But the worst transmit-time dip reached 1.80 V, just above the brown-out band.
- About 4%: the cell rests at 2.37 V, yet the worst dips hit 1.66 V, right at the top of the 1.57 to 1.64 V band, and intermittent resets started appearing.
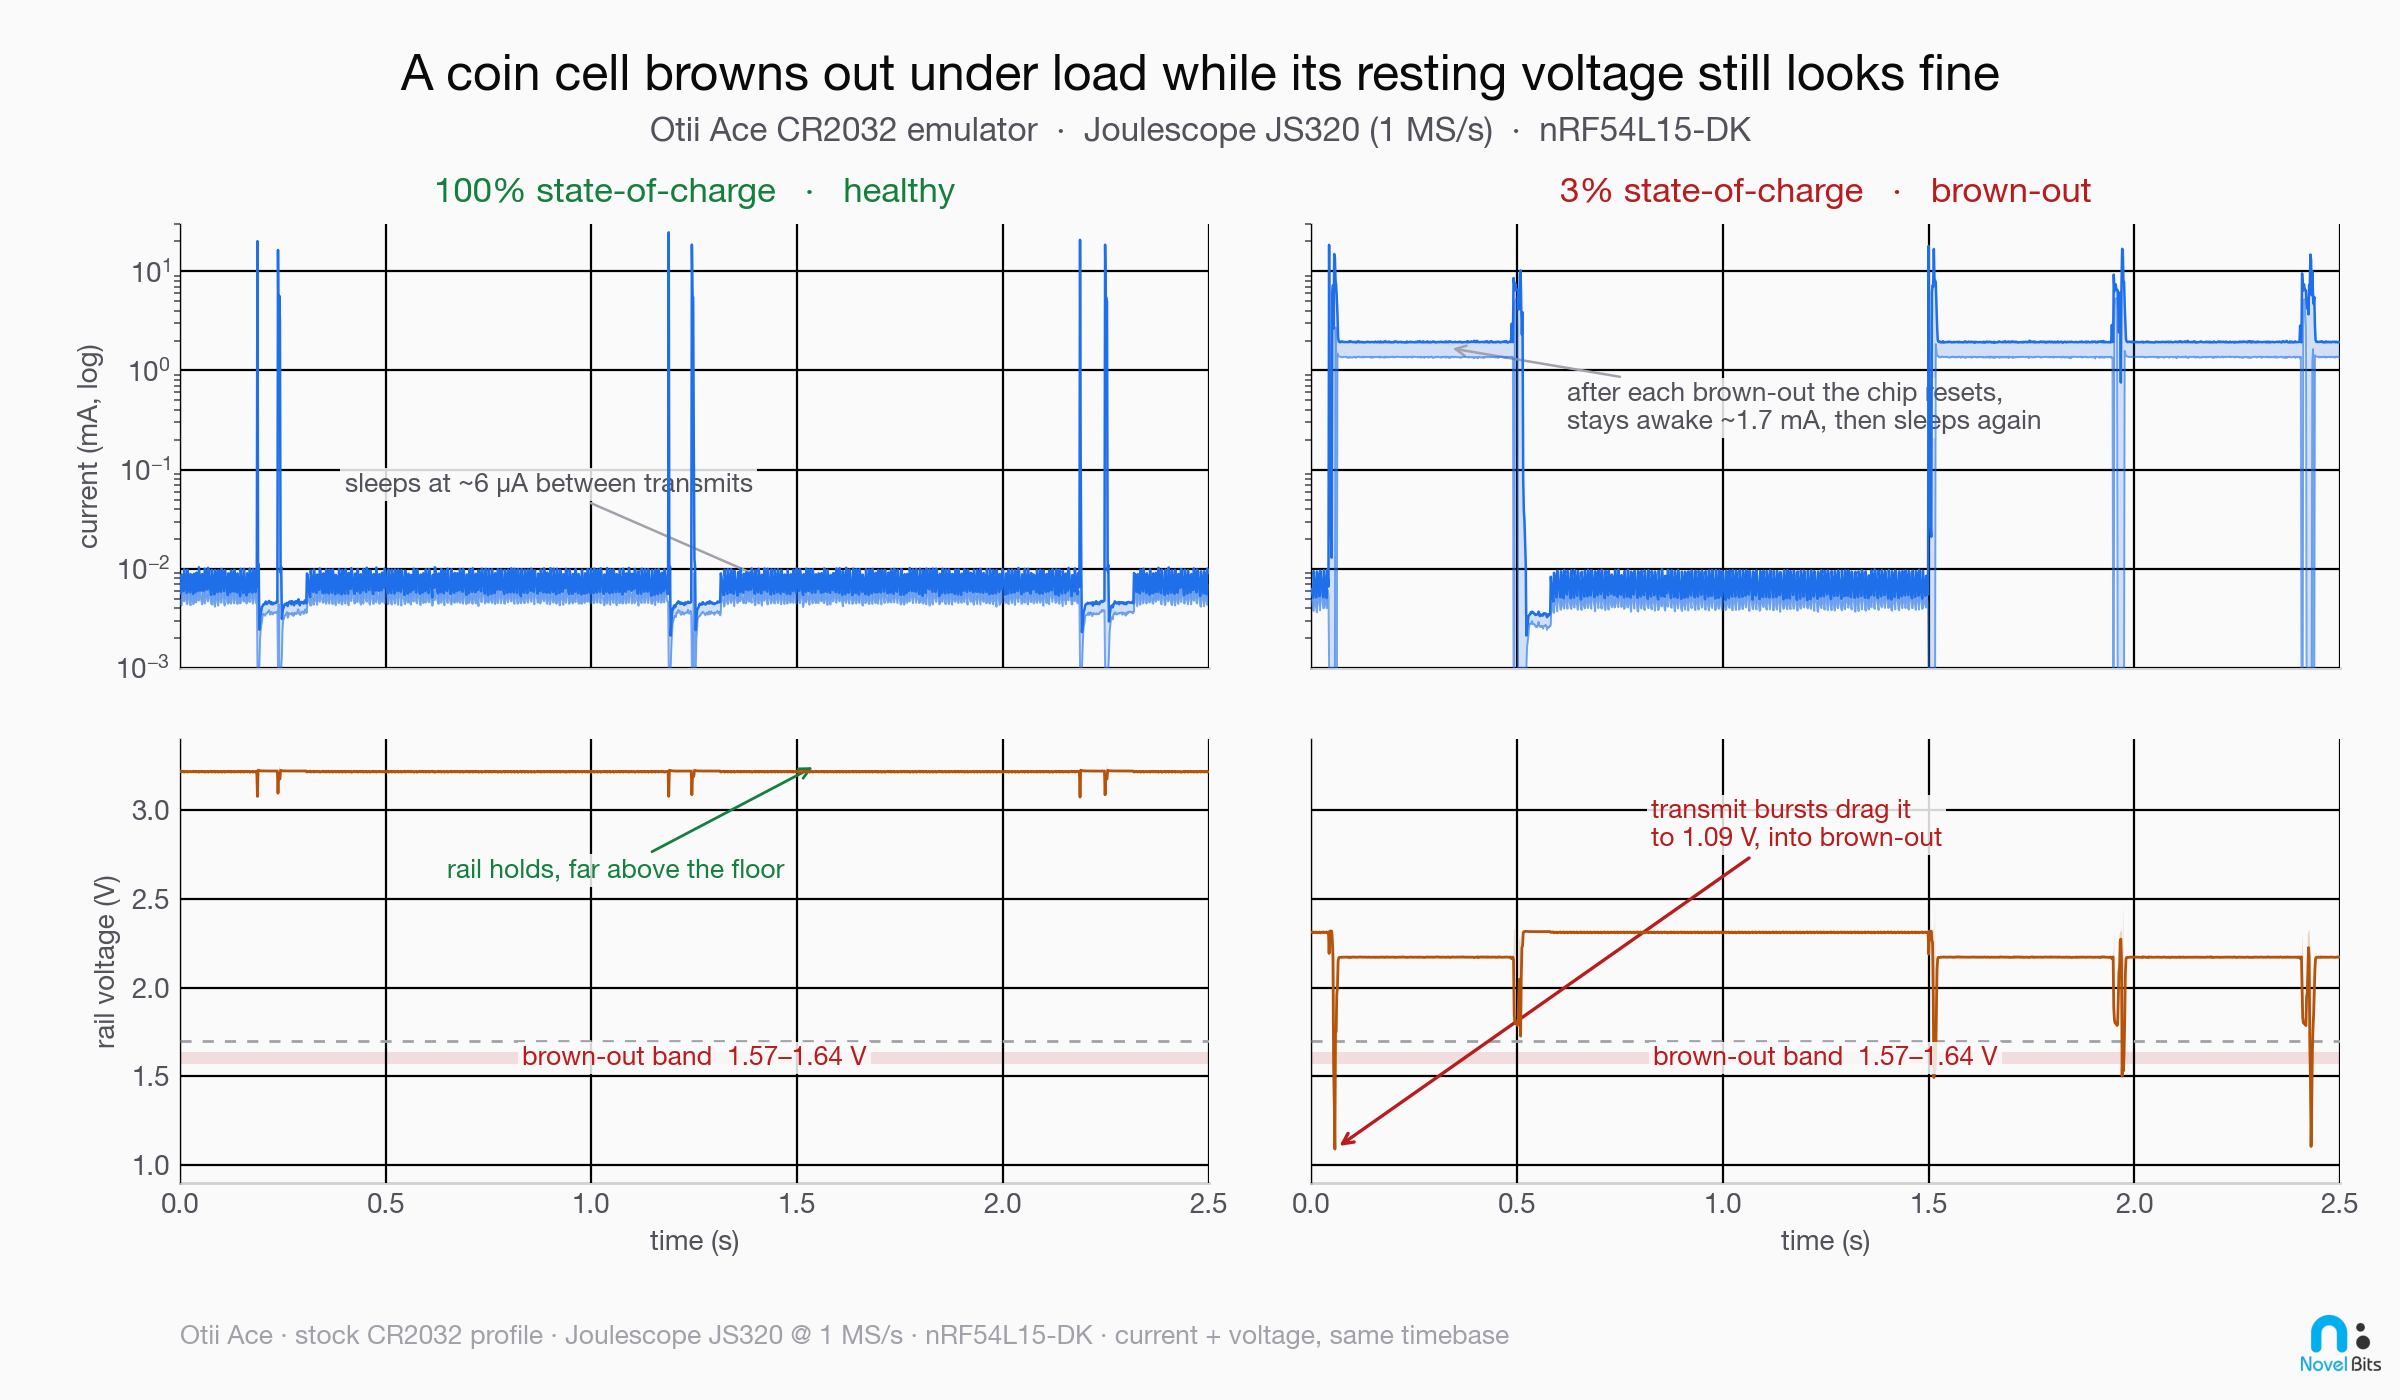
- About 3%: the cell still rests at 2.29 V, well above the 1.7 V floor, but the worst dips crashed to 0.95 V, far below the band. Confirmed reset-cycling: the device was rebooting on its transmit bursts.
This is the gap in one place. At 3% state of charge, a battery gauge sampling the rail at rest reads about 2.29 V and reports a device that is alive and has voltage to spare. The chip, hit by a transmit burst at that same moment, sees 0.95 V and resets. Same battery, same instant, two completely different stories, and the reported number is telling you the wrong one.
There’s an irony in that gap. The Bluetooth LE Battery Service spec defines Battery Level 0% as the point where the battery is “unable to power the device.” By that definition the cell at 3% has already hit 0%: it can no longer carry the chip through a transmit without browning it out. A voltage-based percentage just doesn’t see it, because it reads the rail at rest, while the spec’s own definition of empty is about whether the device can actually run.
The tell wasn’t the average current, either. During reset-cycling the average current actually reads higher, not lower, because the chip keeps waking to pay the reboot inrush instead of sleeping between advertisements. So an “average current” view makes a dying device look busy and healthy. Judge “alive” by whether the device is still doing its job, not by a resting voltage and not by how much current it’s drawing.
One honest caveat: the exact percentage where this happens is not a universal constant. It depends on the specific cell’s resistance curve and on your device’s pulse profile. The profile I used is the stock published Energizer CR2032 model, not one I aged or edited, and its end-of-life resistance climbs past 85 Ω, so treat the single-digit numbers above as “this is the shape of the failure,” not “every CR2032 dies at exactly 3%.” The point that holds for every coin cell is the one in the intro: the device stops working before the cell is empty, and no resting battery reading sees it coming.
That chart traces the trend across state of charge. Here is the same story as a live current-and-voltage trace, healthy at full charge and browning out at 3%:
So when does the battery “really” die?
The reframe is this: for a pulsed Bluetooth LE load on a coin cell, end of life is the moment the transmit-time droop first crosses the chip’s brown-out band, and that moment arrives with meaningful capacity still sitting in the cell. In my run that moment arrived around 4 to 5% state of charge, with the cell still resting above 2.3 V.
Your usable capacity is smaller than your rated capacity, and the gap is set by your transmit-burst current times the cell’s end-of-life resistance. The bigger your bursts and the higher the cell’s late-life resistance, the more capacity you leave stranded. That’s the energy you never get to use, and it’s why both dividing rated mAh by average current and trusting a resting battery percentage overestimate how long the device keeps working.
Here is why that reframe is worth the trouble. Once you know the device quits at the brown-out cliff and not at empty, three things change for you as the developer. The battery-life number on your box becomes one you can defend, because you sized it against usable capacity instead of the headline mAh. You can reproduce the failure on your own bench, on purpose, before a customer hits it in the field as a mystery reset. And you know which lever to pull: the fix is to hold the loaded voltage up during the burst and to warn on the right signal, not to chase a phantom firmware bug or trust a battery percentage that can’t see the cliff.
A brown-out costs more than a reset
Watching the device reboot makes a brown-out look like a recoverable nuisance. Often it isn’t, and the reset is the least of what it does.
The one that should worry you most is a brown-out that lands in the middle of a flash write. A reboot is recoverable; a half-finished write to non-volatile memory is not. If the rail collapses while your firmware is saving bonding keys, a settings change, or a log entry, you can corrupt that data or leave the device stuck in a bad state. This is the real reason the chip carries a power-fail comparator (POF): it lets you stop and shed load before the rail reaches the brown-out band, instead of finding out about the damage after the next reset.
The failure also feeds itself. Reset-cycling keeps the chip awake and drawing far more current than it would asleep, so it runs through the sliver of capacity that’s left much faster than a sleeping device would. The more it browns out, the quicker it drives the cell toward the steep end of the resistance curve, where it browns out more easily still.
If your product holds a connection instead of just advertising, there’s one more cost. Each reset drops the Bluetooth LE connection, the link falls over on a supervision timeout and the device has to reconnect, and anything kept only in RAM (counters, buffered samples, session state) is lost every time.
What you can do about it
The good news: this is a well-understood problem with known fixes. Let’s go through the ones that matter most:
- Add a reservoir capacitor across the cell. This is the single highest-leverage fix. A capacitor in parallel with the coin cell supplies the transmit pulse, so the cell only has to deliver the average current and recharge the cap slowly between bursts. TI’s coin-cell app note found this can recover more than 40% of usable capacity on poor-quality cells, and a real Bluetooth LE design typically needs something in the tens of microfarads (roughly 20 to 50 µF), not a huge bank.
- Bring down the transmit-burst current where your link budget allows, by reducing transmit power or sending fewer/shorter events. Minimizing average current still matters most for total runtime, but the burst current is what sets the brown-out cliff.
- Warn on the power-fail comparator (POF), not on a battery percentage. Set the POF above the brown-out band so the device gets a warning interrupt and can shed load (skip a transmit, drop to a safe state, flag low battery) before it resets. The POF watches the actual rail; a reported percentage derived from a resting sample does not, so it is the POF, not the percentage, that should drive your low-battery behavior. Just don’t mistake it for a fuel gauge: the POF is a comparator that fires a single warning when the rail crosses a threshold you set, an end-of-life alarm you act on, not a continuous read of how much runtime is left. It also has to be enabled in firmware; it is off by default.
- Don’t trust a rest-voltage percentage as your field health signal. If you report battery level over the Bluetooth LE Battery Service or to a dashboard, understand that it tracks energy at rest, not the loaded-voltage margin that fails first. Treat a falling level as “schedule a replacement,” never as “the device is still operating fine until this hits zero.”
- Derate usable capacity in your battery-life math. Don’t divide the full rated mAh by your average current. Assume you lose the last chunk to rising resistance, and size accordingly.
- Pick cells by their behavior under load, not just by the headline mAh. Two cells with the same rated capacity can have very different late-life resistance.
How to see it before your customer does
Fixing this is the easy part. Seeing it during development is the hard part, because a bench power supply will happily hold a perfect rail right up until the moment you’d never reach in the field, and your device’s own battery reading will agree with it. You need to reproduce a depleting, high-resistance cell. There are two ways to get there.
The first is hardware in the loop: a battery emulator that replays a real cell’s discharge and resistance curves and physically makes your board brown out, the way the Otii rig above did. This is the most convincing because your actual firmware actually resets, which surfaces the real failure modes (brown-out handlers, capacitor sizing, the POF configuration, and whatever your battery-level reporting does as the rail sags).
The second is projection from a measurement: take a measured current trace of your device and combine it with a cell’s published resistance-vs-capacity curve to compute the loaded-voltage dip and the runtime, before you ever wire up an emulator. Because the cell models are public data (Qoitech, for example, publishes a library of battery profiles as plain files), this kind of projection can live in software.
That second path is the one we’re building toward in PowerScope, our power-profiling extension for VS Code (coming soon). The premise is to profile power where you already write firmware, so it happens continuously as you develop, not once in a while on a lab bench. Most power tools hand you a current trace and leave you to work out which part of your firmware caused each spike. PowerScope does the reverse: it lines each current pulse up against the Bluetooth LE event behind it, so you can see which advertising or connection event actually spent the energy, and how much. It runs off the affordable meters already on your bench, the Nordic Power Profiler Kit II or a Joulescope, not a rack of lab instruments.
The piece still in progress is the projection: take that same capture, lay it over a published cell model, and read off a defensible battery-life number and an honest brown-out warning, without re-wiring the bench for every what-if. The aim is to turn the bench exercise above into something you run on every build, so a power regression gets caught the same way a failing test would. It is not out yet, but it is coming soon; until it ships, the bench work in this post is how you get there today.
Both get you to the same place: a battery-life claim, and a battery-level report, that survive contact with a real coin cell.
Summary
Let’s recap what we covered:
- The battery level your device reports is a voltage reading taken at rest, and it estimates energy remaining. Your device browns out under load, when the voltage sags, so the reported percentage is blind to the failure that takes it down.
- A coin cell is not a fuel tank. Its terminal voltage under load is
OCV − (I × ESR), and the internal resistance (ESR) rises steeply near end of life. - Bluetooth LE draws short, tall current pulses, and those pulses hitting a rising resistance cause a large transmit-time voltage droop, even while the resting voltage looks fine.
- A chip like the nRF54L15 brown-out-resets around 1.57 to 1.64 V, so a single deep droop can take the device down and trigger reset-cycling. On the bench, an emulated CR2032 drove an nRF54L15 into reset-cycling at single-digit state of charge (around 3 to 5%), while the resting voltage still read above 2.2 V.
- The fixes are a reservoir capacitor, lower transmit-burst current, warning on the power-fail comparator instead of the battery percentage, honest capacity derating, and picking cells by their behavior under load.
With this, you can size your next coin-cell product around the capacity you can actually use, report a battery level you can trust, and catch the brown-out cliff on your bench instead of in the field.

Bluetooth LE Power & Battery-Life Consulting
I help product teams measure real current draw, diagnose brown-outs, and turn battery-life claims into defensible, bench-verified numbers.


