


Somewhere in your product there’s a battery estimate. Someone wrote it in a spreadsheet, probably early, probably before the firmware existed, and it’s been quoted in meetings ever since.
Then the firmware got written. Along the way, four decisions were made about how your device advertises. What transmit power to use. What to put in the advertising payload. Whether to be scannable. How often to advertise. Each of those was made by a different person on a different day for a different reason, and not one of them was made in front of the spreadsheet.
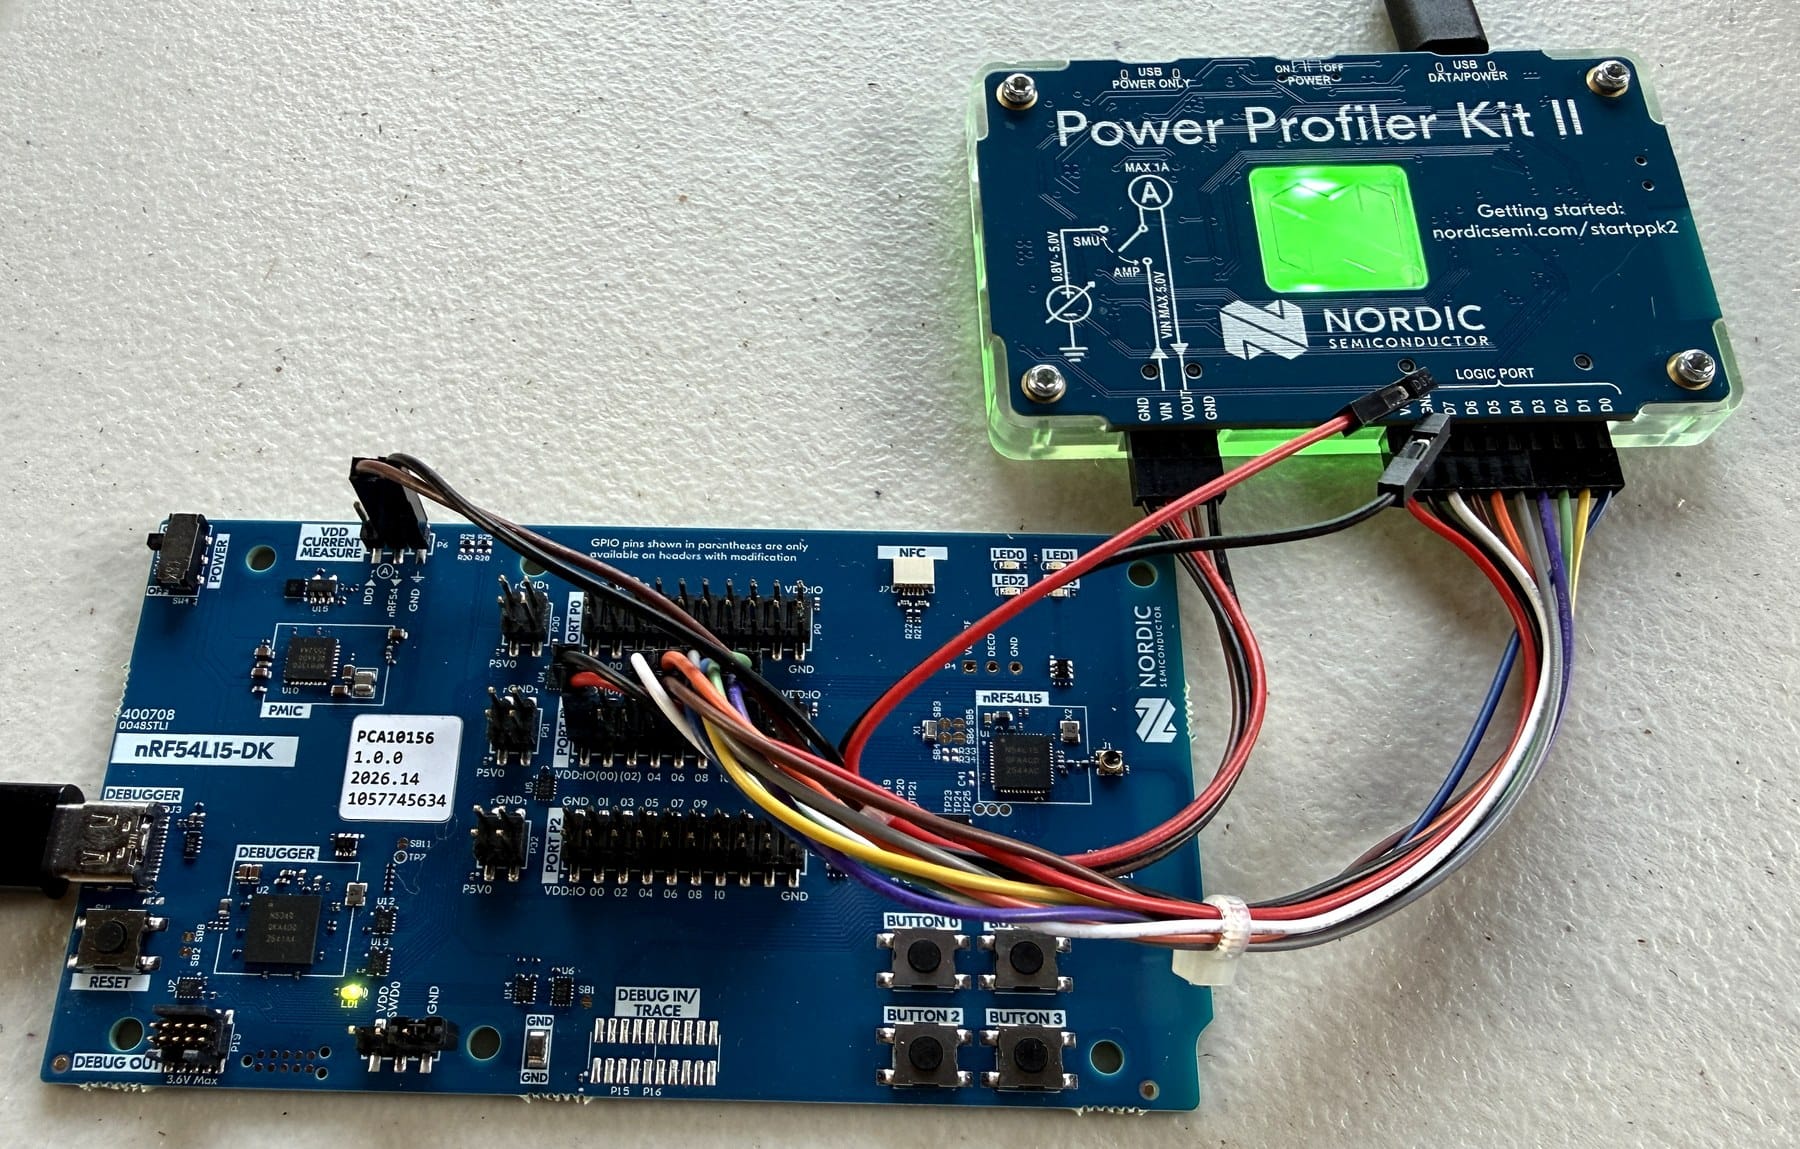
So I put a Nordic Semiconductor nRF54L15 on a power measurement kit and priced all four.
Here’s the headline. Three of the four change what a single advertising event costs, and the transmit power dial is not symmetric: it costs substantially more to turn up than it refunds when you turn it back down. The fourth decision, the interval, doesn’t change the price of an event at all. It changes how many of them you pay for.
That fourth result is the dull one, and it’s in the table deliberately. A bench that can’t show you a lever doing nothing hasn’t earned your trust when it shows one doing something.
The table
Every row is the same board, the same session, the same firmware, at 1.8 V, on nRF Connect SDK v3.3.0. Energy is attributed to each Bluetooth LE advertising event rather than averaged across the whole capture, so these are per-event figures covering all three primary advertising channels (37, 38 and 39). Unless a row says otherwise, the device advertises non-connectable and non-scannable on the LE 1M PHY with 17 bytes of advertising data, once per second.
Every row is a single 30-second capture. That matters for how hard you’re allowed to lean on any one of them, and I’ll come back to it immediately.
| Decision | Setting | Energy per advertising event |
|---|---|---|
| Transmit power | +8 dBm | 31.65 µJ |
| +4 dBm | 20.73 µJ | |
| 0 dBm | 15.80 µJ | |
| -8 dBm | 11.80 µJ | |
| -20 dBm | 10.98 µJ | |
| -40 dBm | 9.32 µJ | |
| Payload | 17 bytes of advertising data | 15.49 µJ |
| 27 bytes (a new 8-byte field) | 18.79 µJ | |
| Scannable | Not scannable | 15.49 µJ |
| Scannable | 23.33 µJ | |
| Interval | 100 ms | 15.68 µJ |
| 200 ms | 15.35 µJ | |
| 500 ms | 15.58 µJ | |
| 1 s | 15.19 µJ | |
| 2 s | 15.56 µJ |
Let’s read down the interval block, then read down the transmit power block. That contrast is the post.
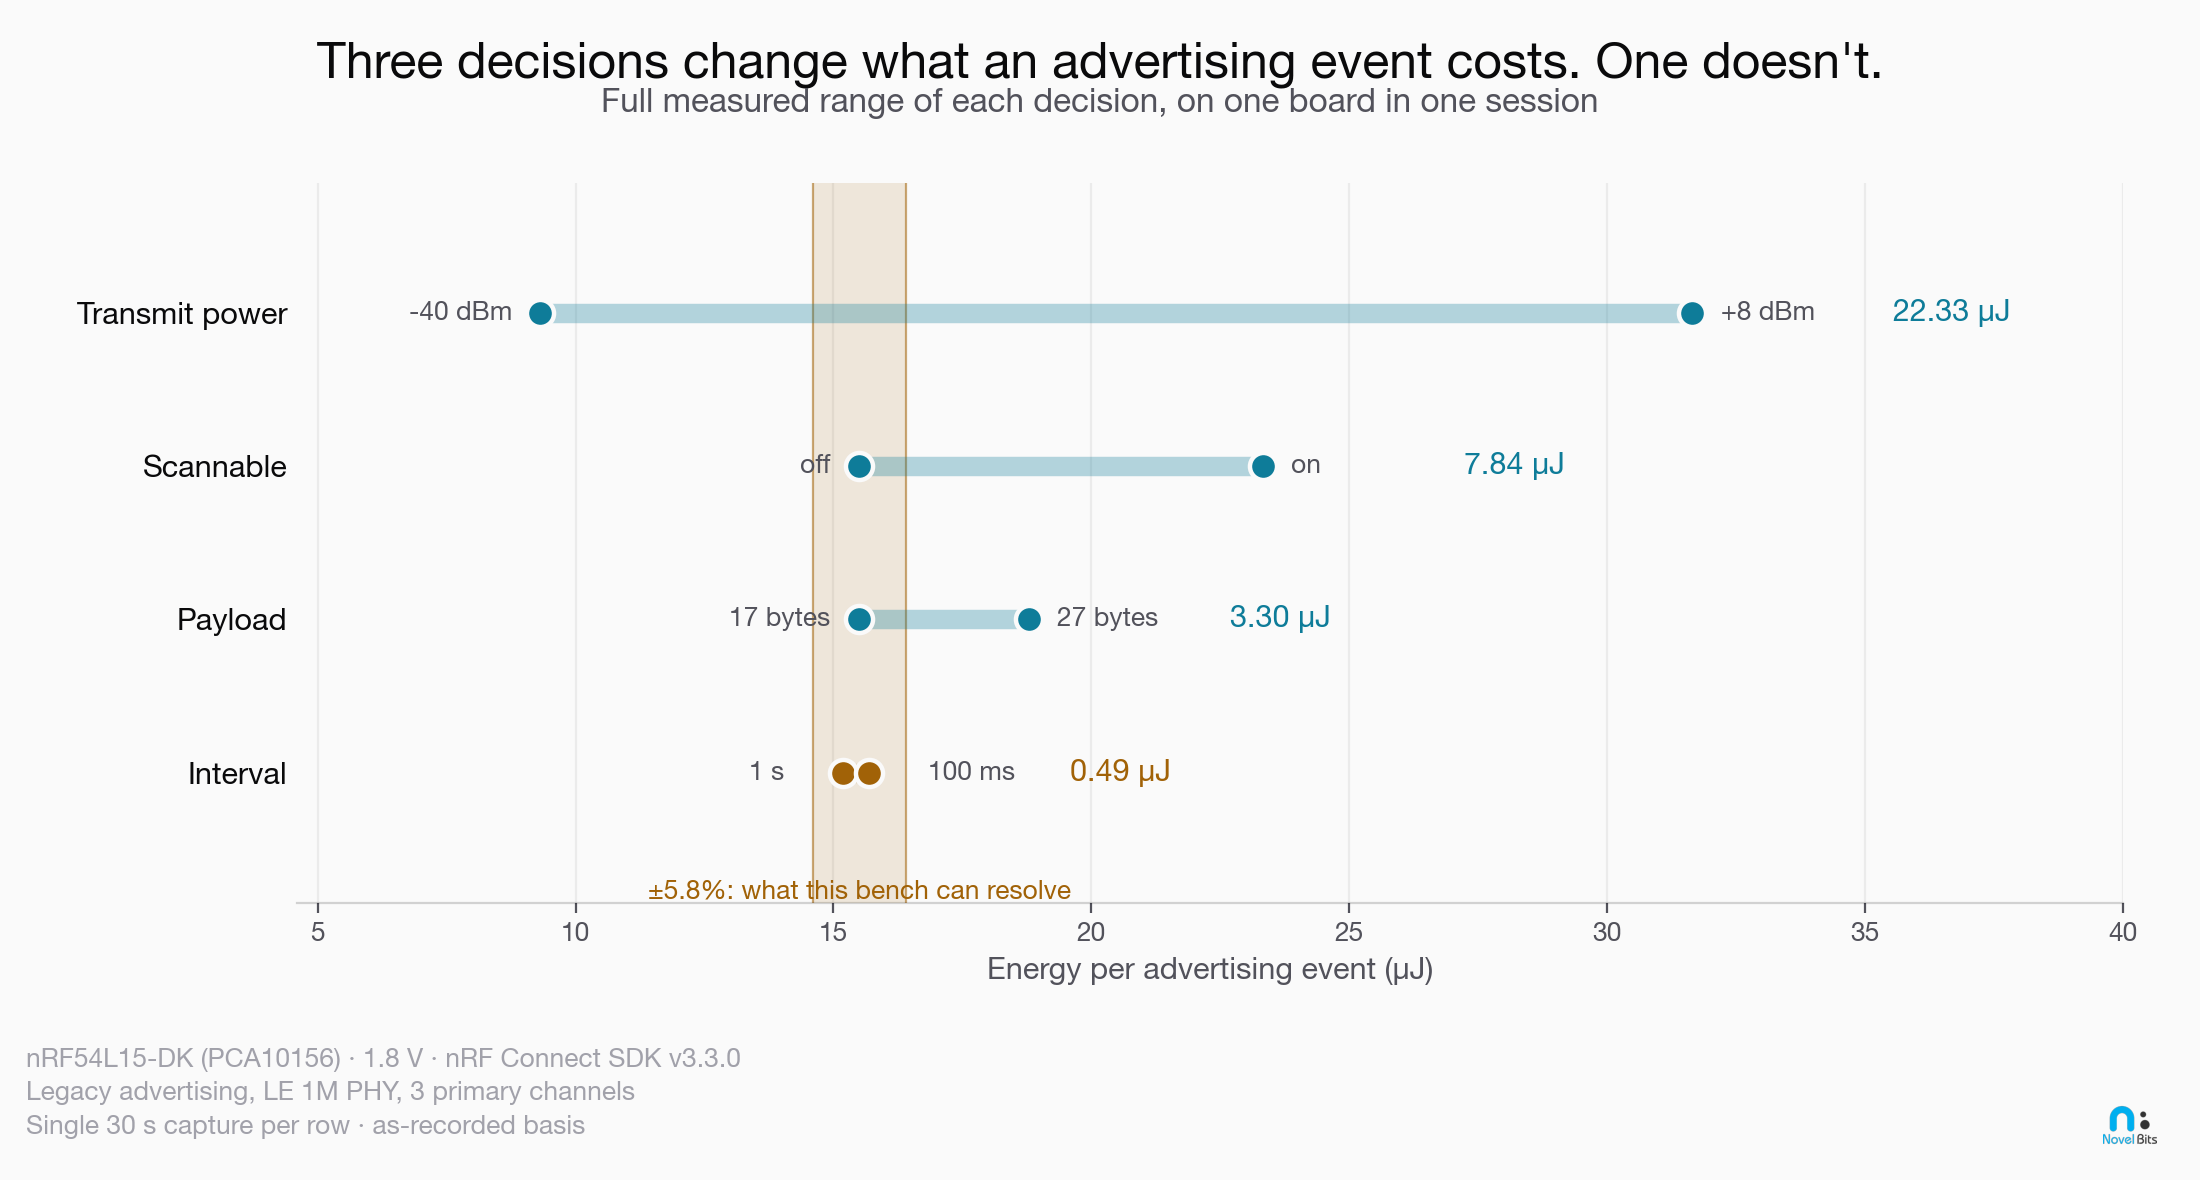
First, notice that the same configuration appears three times at three different numbers. The 0 dBm row, the 17-byte row and the 1 s row are all the same advertiser, and they read 15.80, 15.49 and 15.19 µJ. That spread is about 4%, and it’s not a finding about anything. It’s the bench. I’ve left it visible rather than averaging it away, because it’s the most useful thing on the page: it tells you how much of any other number here you should believe.
Which brings me to the two things you need before the rest of it means anything.
The resolvable difference on this rig is about 5.8%, and that’s a lower bound, not a margin of error. I got it by running identical firmware eight times. But those eight repeats share one build and one flash, so they measure the easiest comparison the bench can make, while every comparison in the table above crosses a rebuild and a reflash. When I’ve measured the same non-scannable configuration across separate sessions, it’s spanned about 6%, which is wider than the floor derived from the repeats. So: anything under about 6% isn’t a result, it’s the bench breathing.
Second, the basis. These figures are computed on the same sample basis that Nordic’s Power Profiler applies by default, which includes its spike filter for the artifact the PPK2 produces when it switches current ranges. I have a further correction of my own on top of that, and with it these levels come out around 8 to 20% lower. I’m publishing without it, for a plain reason rather than a noble one: my correction has no independent validation yet, and Nordic’s default does.
If you saw my Bluetooth LE post on scan responses earlier this week, its absolute figures were on my corrected basis, which is why a non-scannable advertiser reads 13.42 µJ there and 15.49 µJ here. Most of that gap is the basis and the rest is that they’re separate captures, which is exactly the 6% I just described.
One more thing about the rig, since it’s part of what I measured: the board is instrumented, and those connections are on the meter throughout. They’re inside every number here.
Decision one: transmit power, and why it’s a one-way street
Raising transmit power costs about four times what turning it back down gives you.
Going from 0 dBm up to +8 dBm adds 15.86 µJ to every advertising event, which is roughly a doubling. Coming back down 8 dB from 0 dBm returns 3.99 µJ. That’s a ratio of about four to one, and it held between 3.6 and 4.1 under every way I tried correcting the capture, including not correcting it at all. Read that as robust to method rather than repeated, though: it’s one ladder, run once per setting, reanalyzed several ways. It isn’t the ladder measured twice.
Most of the asymmetry is just decibels doing what decibels do. This dev kit mounts the QFN package, which the datasheet rates at 7 dBm typical output, so going up from 0 dBm buys about 4 mW more on paper while coming down 8 dB gives back well under 1 mW. That alone predicts nearly five to one. Read that as nominal rather than firm, though: the same datasheet rates RF power accuracy at plus or minus 2 dB, and running the arithmetic at those edges spreads the on-paper prediction from under three to one to over eight to one.
The measured four to one is worth being careful about, because the obvious explanation is wrong. It isn’t the radio’s fixed costs. A cost that’s identical at every power setting cancels out of both differences, so it can’t move the ratio at all, in either direction.
What’s actually going on is that the current the radio draws doesn’t scale with the power it puts out, and you don’t have to take my bench’s word for that. Nordic’s datasheet lists radio current at 3.7 mA at 0 dBm and 9.1 mA at maximum for this package. Radiated power over that step rises about five-fold while the current rises less than two and a half. Their own typicals describe a transmit chain that is around nine percent efficient at 0 dBm and about eighteen percent at the top, and it stays that way after you subtract the 1.2 mA the radio still draws at -40 dBm. So it isn’t a fixed cost hiding in the numbers either.
That also gives the four to one something to stand on, which matters because the accuracy band above means my bench can’t establish it alone. Nordic’s radio-only currents predict about 3.6 to one for this package. Their Online Power Profiler, set to the same board, voltage, payload and interval, predicts about 3.2. I measured 3.97. Three independent routes, same shape.
Then the ladder flattens. The remaining 32 dB, from -8 dBm down to -40 dBm, returns about 2.5 µJ in total, and somewhere between 1.4 and 2.6 depending on how you correct the meter, because so little is left by then that the correction starts to dominate. Thirty-two more decibels bought less than the first eight did. Whatever’s left by then clearly isn’t tracking how loud you transmit, and I measured it at the supply pin, so I can tell you it’s there without telling you which block it is.
The practical shape is worth sitting with. If you’re at 0 dBm and worried about battery, transmit power isn’t where your next microjoule is. But if somebody asks you to turn it up, that’s the expensive direction, and it’s the one that gets chosen under pressure. Transmit power tends to get raised late, after a field report about a dead spot in a stairwell. It’s a one-line change, it rarely goes back through a power review, and the estimate in that spreadsheet doesn’t move. At one advertising event per second, that one-line change adds about 8.8 µA of average current, or roughly 0.2 mAh a day, for the life of the product.
One honest caveat on the top row. +8 dBm is a real setting on this part, not an out-of-range request: nRF Connect SDK exposes the range as -8 to +8 dBm for this board, and Nordic’s own benchmark configuration for it selects +8. What the QFN package on this kit is rated to deliver is 7 dBm typical, and Nordic documents the split plainly: 8 dBm for the CSP variants, 7 dBm for the QFN ones. Nothing at build time or run time warns you about the difference. So read the top row as the energy cost of asking for +8 dBm. I measured what the radio drew, not what left the antenna.
Decision two: payload, and the two bytes before your first byte
Adding eight bytes to your advertising payload can cost you eight bytes on air, or ten. It depends where you put them.
Advertising data is a list of AD structures, and each one carries a length octet and a type octet in front of its data. Append eight bytes to a field that’s already there and you transmit eight more. Add them as a brand new field and you transmit ten.
I measured the second case. Advertising data went from 17 bytes to 27, the packet on air went from 33 bytes to 43, and the time on air per packet went from 264 µs to 344 µs. Since the event repeats on all three channels, that’s 792 µs of air becoming 1,032 µs. The energy went up by 3.30 µJ per advertising event.
Now, how much should you trust that? Less than two significant figures suggests. The baseline it’s subtracted from is a single capture, and it happens to sit high against repeats of the same configuration, so re-anchoring on the repeat average would move the per-byte figure by about 16%. Carry it as roughly a third of a microjoule per added byte and don’t build a spreadsheet on the second digit. That’s still enough to answer the question people actually ask, which is whether a new field costs anything worth caring about.
The framing arithmetic underneath it is much firmer than the energy, and it’s worth separating the two. One octet is 8 µs on the LE 1M PHY, and the packet is preamble, access address, header, advertiser address, your data, and CRC. Work that out for a three-channel advertising event and you get 384 µs with no advertising data, 744 µs at 15 bytes, and 1,128 µs at the 31-byte legacy maximum. Those are exactly the numbers the Bluetooth Core Specification publishes in its own table for the same cases. So the airtime side isn’t my measurement at all, it’s arithmetic you can check against the specification.
I did also compare that airtime model against the measured transmit plateau, and it lands within about 4%. I want to be careful about how much that’s worth, though, because it looks like more than it is: both halves come from the same captures on the same meter, so it isn’t an independent check, and 4% is inside the floor I quoted earlier, which means the comparison couldn’t really have failed. What it genuinely tests is the airtime model, and it’s how I caught myself getting the byte count wrong the first time.
The packaging is the part nobody costs. Two new 4-byte fields are two AD structures, so twelve octets of air for eight bytes of data. Manufacturer-specific data is the sharpest version, because the specification requires the first two data octets to be your assigned company identifier. A brand new manufacturer-data field spends four octets on air before your first useful byte: length, type, and two of company ID.
Here’s the part I didn’t expect. Ten more bytes on air is 30% more time transmitting, and it cost 21% more energy. Payload is cheaper than proportional, and the reason is specifically that some of an advertising event isn’t transmission at all. The ramp on either side of the packet, and the fixed cost of waking up and running the event three times, are there whether you send one byte or thirty-one. So your payload gets diluted by everything around it that isn’t sending your payload.
Count airtime, then, because airtime is the thing that moves. And treat adding a field as cheap in isolation and expensive by accumulation. Eight bytes is a counter and a short name. Nobody reviews it. It rides along on every advertising event for the life of the product.
Decision three: scannable, and the number your room writes for you
Making that same advertiser scannable took it from 15.49 µJ to 23.33 µJ per event, about half again.
But that number isn’t really mine to give you, and this is the most important sentence in the section: it’s a property of the room I measured it in. Packets per event went from exactly 3.0 to an average of 4.6, and varied by 28% across the capture. Those extra packets are scan requests arriving from whatever phones and gateways happened to be nearby, and the responses my device sent back. I’ve measured the same comparison anywhere from about 42% to 60% depending on which baseline capture I anchor on and what the room was doing at the time. Move the board somewhere quiet and it falls. Move it into a warehouse full of scanners and it climbs.
Three separate things are bundled inside that gap:
- Opening the receive window after each packet. Independent of your environment.
- Receiving the scan requests that arrive. Depends on your environment, and unavoidable.
- Transmitting the scan responses. Depends on your environment, and the only one you can switch off.
A desk can’t separate the first from the second, because ambient scan traffic isn’t something you can turn off by putting your own phone in a drawer. Splitting them takes an RF chamber, and that measurement is scheduled. The third one is genuinely controllable: the advertising filter policy restricts scan-request processing to devices on your Filter Accept List, and with an empty list your device listens but answers nobody. I wrote about that in detail earlier this week, including the way it fails silently on Zephyr if you enable the advertising option without also enabling the accept list.
The row above is a non-connectable scannable advertiser, which is the clean version of the question. If your device is connectable and undirected on legacy advertising, you don’t get to choose: there’s no connectable, undirected, non-scannable legacy advertising PDU, so you’re scannable whether you wanted to be or not, and the receive window is open regardless because that’s how anything connects to you. The filter policy stops the responding. It never stops the listening.
On extended advertising you do get a choice. The specification defines a connectable undirected event type there that ignores scan requests outright, which is the one thing the filter policy can’t do for you. It isn’t free, since your connection window moves onto a secondary channel, but if you’re already on extended advertising it’s worth knowing the option exists.
And connectable, undirected is what most peripherals do. Plenty of them put nothing useful in the scan response and are still sending one every time, on a device whose battery someone already promised a customer.
The exception is real, and you’ll know if it’s you. If you deliberately use the scan response because 31 bytes wasn’t enough, you need those answered. That isn’t a saving, it’s a price.
Decision four: interval, which doesn’t do what the other three do
Now let’s look at the interval block again, with what it did to the average current beside it.
| Interval | Energy per event | Average current | Charge per day |
|---|---|---|---|
| 100 ms | 15.68 µJ | 86.8 µA | 2.1 mAh |
| 200 ms | 15.35 µJ | 46.4 µA | 1.1 mAh |
| 500 ms | 15.58 µJ | 23.4 µA | 0.56 mAh |
| 1 s | 15.19 µJ | 14.4 µA | 0.35 mAh |
| 2 s | 15.56 µJ | 10.6 µA | 0.26 mAh |
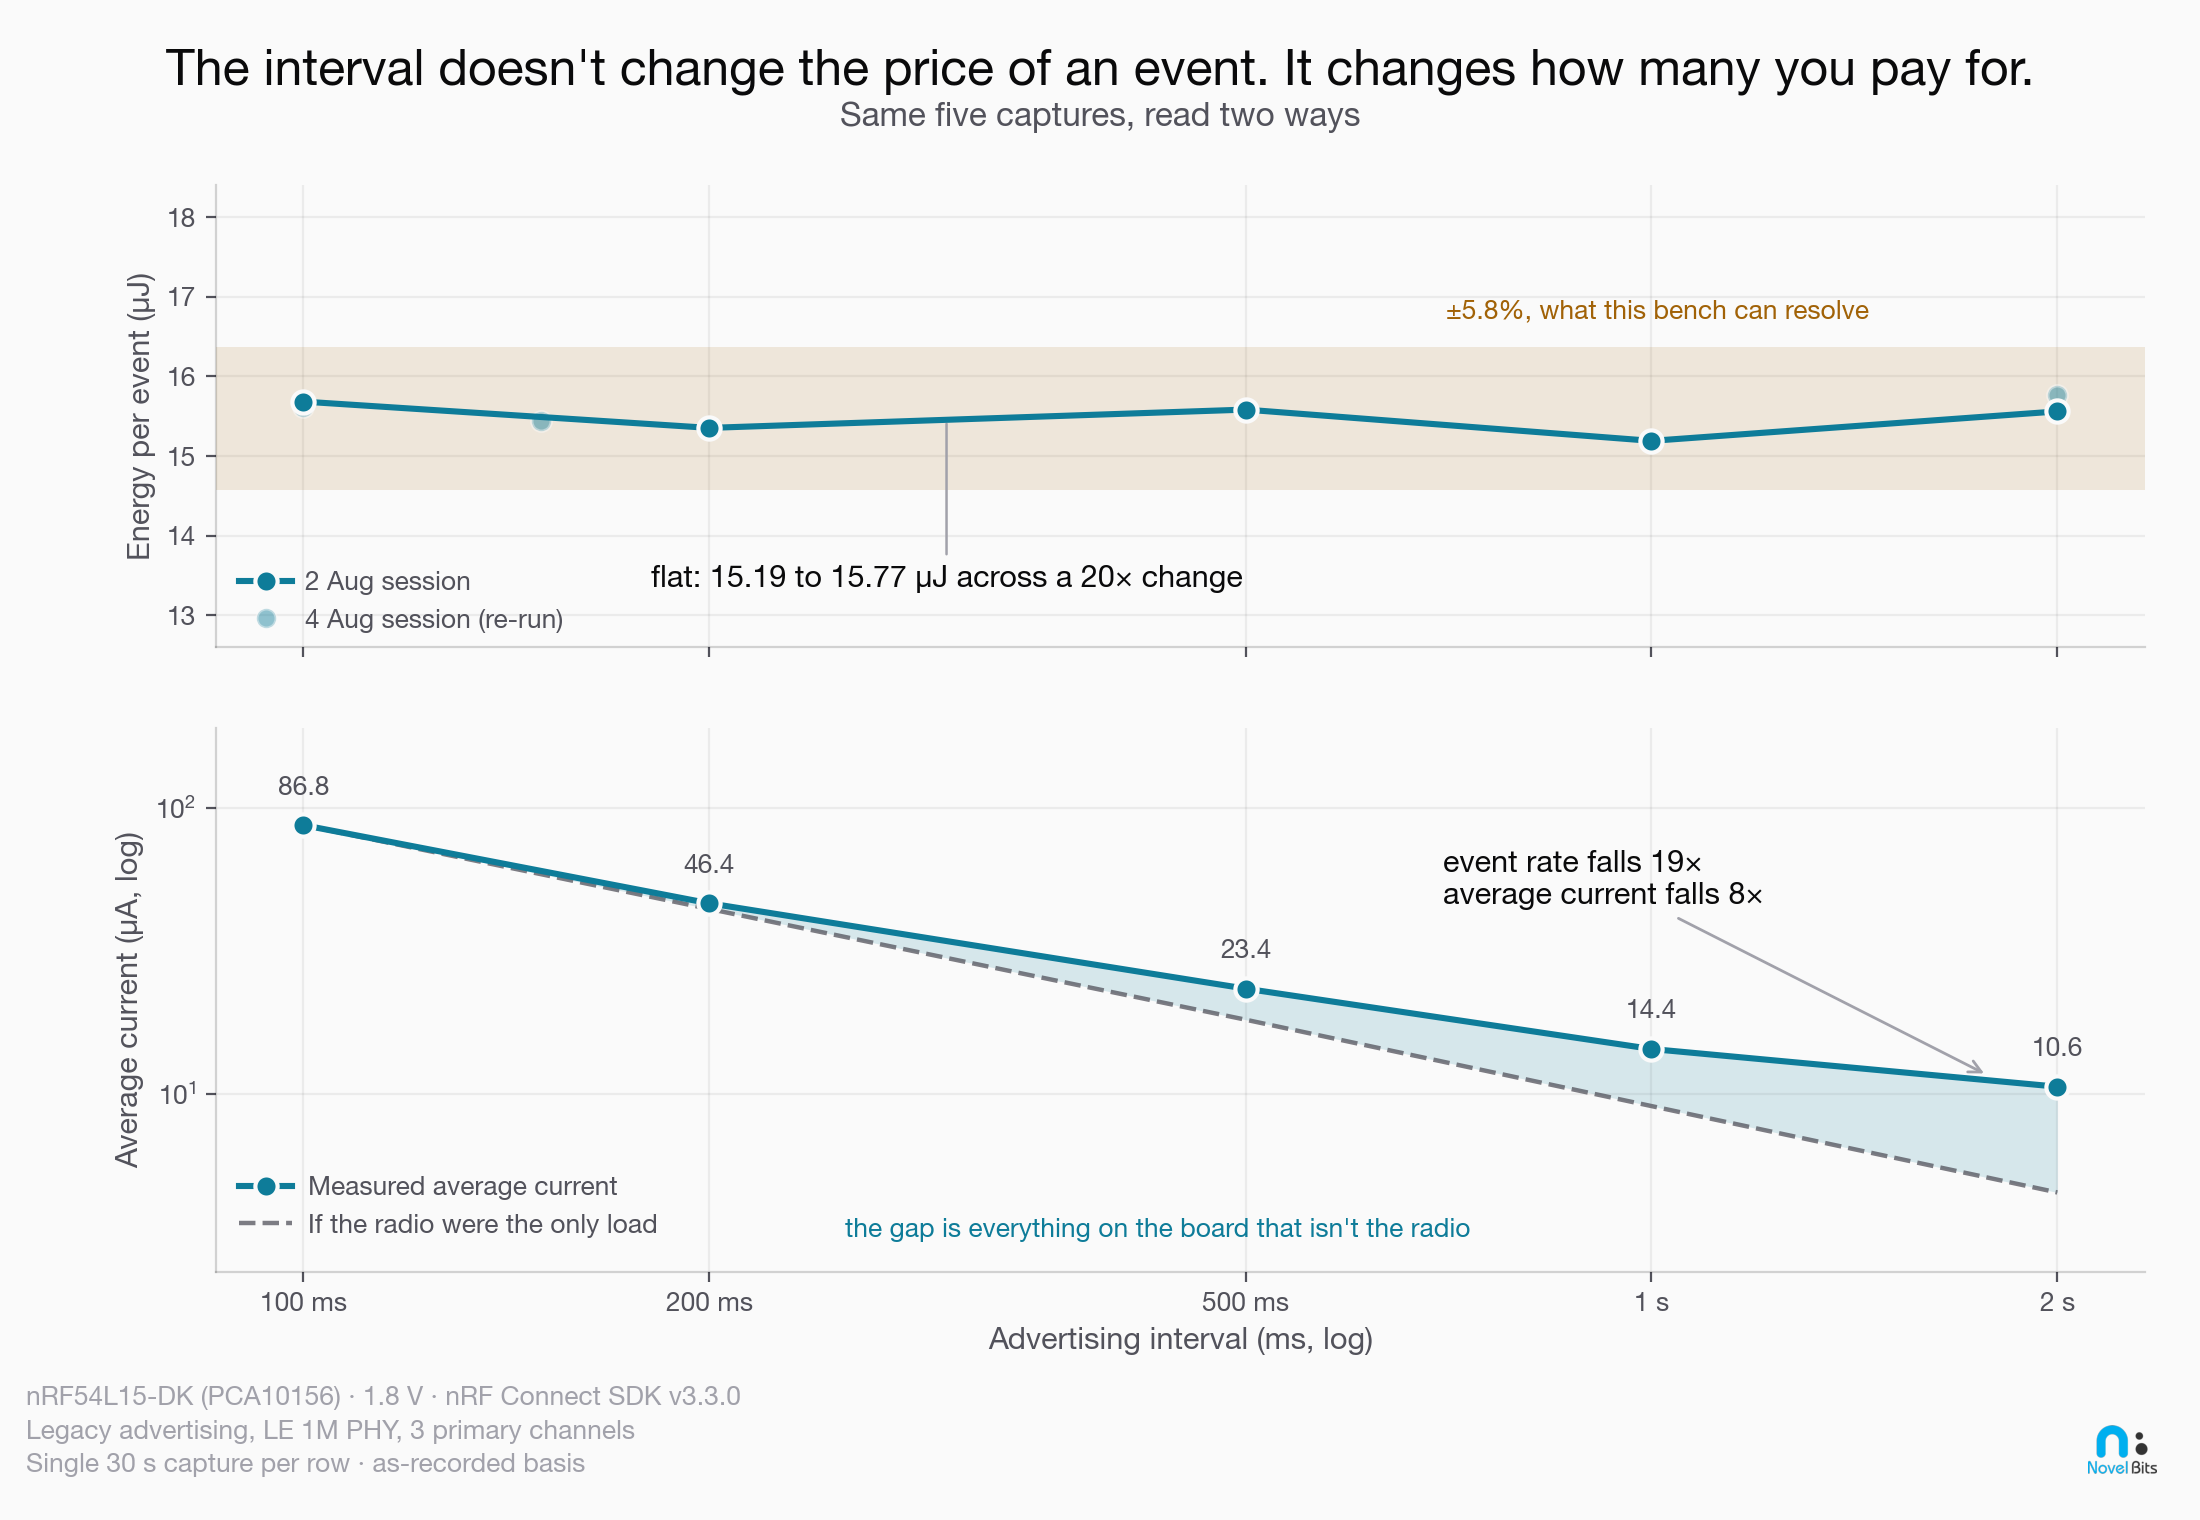
The advertising interval changed by a factor of twenty. The energy per event moved about 3%, which is inside the floor. I can’t tell those five numbers apart.
That’s a claim about my bench, not about physics, so let me put a number on it. The smallest per-event effect this setup could have resolved is about 0.9 µJ, so if the interval does change the cost of an event, it does so by less than that. Here’s the cleanest way I can put the same point: my eight repeats at a single interval spanned 4.7%, which is wider than the 3.2% I measured across a twentyfold change in interval. Changing the interval moved the number around less than not changing anything did.
I also went back two days later and re-ran part of the sweep from fresh builds, because a flat line is exactly the sort of result that deserves doubting once. Not the whole ladder: 100 ms, 150 ms, 2 s, and a control at the default. Same answer, and across both sessions nine captures from 100 ms to 2 s span 15.19 to 15.77 µJ.
So the interval isn’t a lever on the price of an advertising event, as far as I can measure. It’s a lever on the quantity. Three of these four decisions change what you pay each time. This one changes how many times you pay.
That sounds like a distinction without a difference until you try to use the table. If you want a cheaper event, transmit power and payload and scannability are your dials and their effects compose. If you want a smaller drain on the battery, the interval is the dial, and it works by multiplication rather than by making anything cheaper. On my board it’s also by far the biggest one, and even a 0.9 µJ effect hiding under my floor would be about 5% of the 100 ms average, against a lever worth a factor of eight.
Two things fell out of the sweep that I wasn’t looking for.
The interval you ask for isn’t the interval you get. At a nominal 100 ms I counted 286 advertising events in 30 seconds rather than 300. That’s not drift and it isn’t a bug. For undirected advertising the specification requires a small random delay, up to 10 ms, to be added between advertising events, so that two devices that start in lockstep don’t stay there and keep colliding. If that delay is spread evenly, it averages 5 ms, which predicts 286 events. I counted 286. At a nominal 200 ms it predicts 146, and I counted 146.
That’s the one genuinely independent cross-check in this whole post, because the prediction comes from the specification and the count comes from the capture. The exact distribution is up to the controller, so treat the 5% over-count at 100 ms as the shape rather than as your number. But if you’ve ever budgeted advertisements per day by dividing 86,400 by your interval, you’ve been quietly over-counting. Nordic's own Online Power Profiler lands in the same place: set a 100 ms advertising interval and it reports an event interval of 105.00 ms straight back at you.
There is something you can do about it, at least on Nordic silicon. The SoftDevice Controller exposes a vendor-specific command, sdc_hci_cmd_vs_set_adv_randomness, that sets the maximum delay directly, and passing zero removes it altogether. It’s a runtime call rather than a build-time option, and it isn’t exotic: Zephyr’s own Bluetooth Mesh implementation uses it to take the randomness off its Friend advertising set. The specification mandates that delay for a reason, though, so know what you’re giving up before you switch it off. Mandates is the precise word: the requirement is written as a shall, so zeroing the randomness on undirected advertising puts you outside the specification rather than merely off the beaten path. It exists so two devices that power up together don’t stay in lockstep and collide on every event forever.
Lengthening the interval stops paying, and you can watch it stop. The event rate falls by a factor of 19 from 100 ms to 2 s. The average current falls by a factor of 8. Those would be equal if the radio were the only thing drawing current, and they aren’t, because something on that board keeps drawing current between advertising events. On my setup it’s about 6 µA, and I know that two ways: it falls out of the interval sweep as an intercept, and four captures where advertising failed to start altogether read 6.2 µA directly. Those two agree to better than 1%.
What I’m not going to do is tell you what it is. Some of it is the sleeping chip, some of it is my own instrumentation, and I haven’t separated them. Naming it before separating it is exactly the mistake this whole exercise exists to avoid, and it would be an easy sentence to write.
Take the shape rather than my number. There’s an interval past which your radio stops being your problem, and past that point the work moves to your sleep mode, your low-frequency clock, and whatever else your firmware wakes up to do. On my board the radio is most of the average at 100 ms and a minority of it at 2 s. Where your own crossover sits is a measurement, not a constant, and it’s one of the more valuable half hours you can spend.
What to do with this
Four decisions, in the order I’d question them on an existing product:
- Interval first, because it’s the only multiplicative one and it’s usually left at a default nobody chose deliberately. Going from 100 ms to 1 s cut the average current by a factor of six on my board. Nothing else here is close.
- Scannability next. If you’re not connectable, the question is whether to be scannable at all. If you are connectable on legacy advertising, the filter policy is your lever, and if you’re on extended advertising you can decline scan requests outright. Whichever applies, your own environment sets the price, so measure it where the product actually lives rather than at your desk.
- Transmit power third, and mostly defensively: know what raising it costs before someone raises it. It’s worth about four times as much going up as coming down.
- Payload last, because a third of a microjoule per byte per event is small, and it’s also permanent, and it’s the only one of the four that tends to grow quietly over a product’s life.
And then go back and look at the estimate in the spreadsheet.
What I didn’t measure
Being clear about the edges of a table is most of what makes it worth citing.
- Every row is one 30-second capture rather than an average of repeats, and the transmit power ladder was run once per setting.
- Temperature was not controlled or recorded.
- One board and one unit, so nothing here establishes part-to-part variation.
- Everything is legacy advertising on the LE 1M PHY. Extended advertising, the LE 2M PHY and the LE Coded PHY are all still ahead of me, and larger payloads need extended advertising to exist at all.
- Ambient scan traffic was uncontrolled, and it is a real input to the scannable rows rather than noise around them.
- The per-byte payload cost rests on a single pair of payload sizes, so it is a cost I measured rather than a rate I proved. Turning it into a rate needs two more points on that axis.
- The transmit power figures come from an SDK setting whose delivered output I did not verify with a spectrum analyzer.
And every figure here is energy drawn on my board, in my room, with my instrumentation, on one SDK version. The reason to publish the conditions in this much detail is so you can tell which of these numbers might transfer to your product and which certainly won’t.
If you’d like the next one of these, the Novel Bits newsletter is where they land first. Next in this series: what happens to all of this on extended advertising and the other PHYs.


