


The misdiagnosis
You’ve built a low-power Bluetooth LE beacon and you’re finally at the point of checking the power numbers. The datasheet says a couple of microamps between advertising events, so that’s the shape you’re expecting on the analyzer: a flat, almost-nothing floor with little spikes where the radio wakes up to advertise. What you actually get is a floor sitting above 100 µA, and it stays there. The radio’s asleep, your code is not doing anything, and the number won’t come down.
So you start working through the usual suspects. You check the
advertising interval. You go through prj.conf looking for a
peripheral you left on. You start wondering about the Bluetooth stack,
or whether it’s DC/DC versus LDO, or that sensor you meant to power
down. An afternoon goes by.
The afternoon is wasted, because the hundred-plus microamps is not your firmware at all. It is your console, and I’ve been bitten by this more than once.
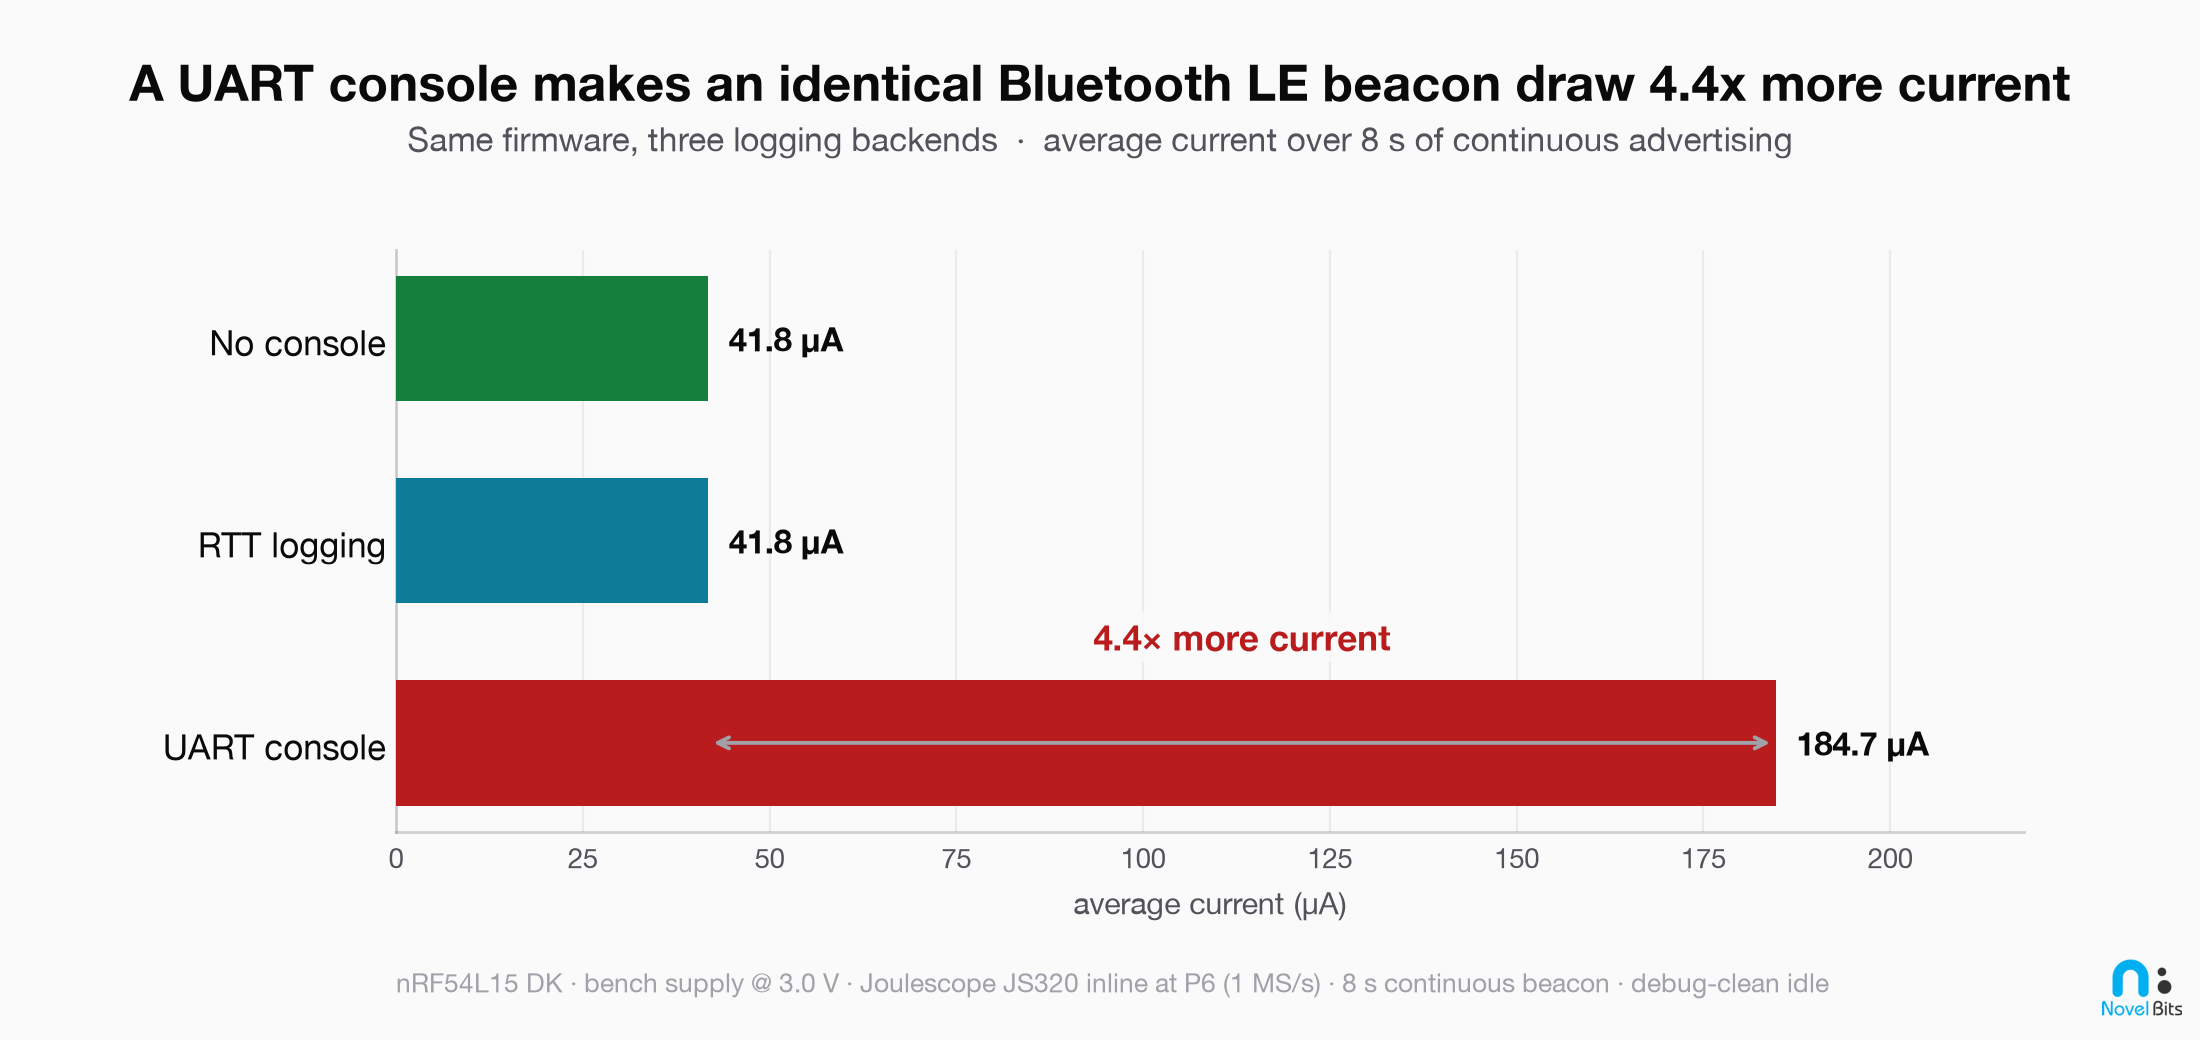
A UART console, the one you added on day one so you could see log output, holds the high-frequency clock on and stops the chip from ever reaching deep sleep. On the bench below it pinned the sleep floor about 45 times higher than the chip’s real idle current, and pushed the beacon’s average current up by 4.4 times.
The firmware never prints a single line. The console is enabled and idle the entire time, and just having it there is what drains the battery. It is one of the first things worth checking when a “2 µA design” measures in the hundreds of microamps, and it’s easy to miss, because the console is invisible. It is just how you’ve always seen your logs.
Before we get to the bench, let’s clear up one thing, because it is not the real risk here.
It will not drop your connection
Ask around and you’ll hear one specific fear about logging on a
Bluetooth LE device: that a slow log call makes the radio miss a
connection event and drops the link. It is a reasonable thing to worry
about, and let’s pin down where it’s actually true, because that depends
on how your printk is wired.
A printk() that writes straight to a UART console really
does block: your firmware does not return until every character has
physically gone out the wire. Nordic’s own documentation says so
plainly: printk “will not return until all bytes are sent.”
At a common 115200 baud, with 1 start bit, 8 data bits and 1 stop bit,
that’s 10 bits per byte, or about 87 µs per character, so a
40-character log line costs roughly 3.5 ms of blocked CPU
time. You can work that out from the baud rate alone, no bench
required.
Whether you actually get that path comes down to one Kconfig symbol.
vprintk() checks CONFIG_LOG_PRINTK, and when
it is set your printk output goes into the logging
subsystem instead of to the console driver. It only exists when the
logging subsystem is compiled in, and it defaults to y, so
on an ordinary CONFIG_LOG=y build your printk
calls are already going through logging. In the default deferred mode
the message is handed to a buffer and the call returns without waiting
on the wire. That is the configuration on the bench below, and it is
part of why the blocking fear is the wrong one to carry.
Keep in mind that there are three ways to end up on the blocking
path: CONFIG_LOG=n, CONFIG_LOG_MODE_MINIMAL=y,
or setting CONFIG_LOG_PRINTK=n yourself. Watch out for
minimal mode, because it routes your LOG_INF calls through
printk as well, so those block too.
CONFIG_LOG_MODE_IMMEDIATE=y gets you there by a different
route: the message still goes through the logging subsystem, but it is
processed in the context of the call rather than deferred.
Take the worst case anyway, a build where printk really
does block for those 3.5 ms. The failure mode still does not
happen: on Nordic’s architecture, that blocked time cannot make your
Bluetooth LE stack miss a connection event. The radio and its
connection-event scheduling run inside the Multiprotocol Service Layer
(MPSL), and MPSL registers its timing-critical handlers at the highest
interrupt priority the core offers, as zero-latency interrupts that the
kernel cannot mask. Nordic warns in its own documentation that
interrupting or delaying those handlers is undefined behavior, which
tells you how the layer is meant to be treated; the reason ordinary
application code cannot do it is the priority, not the warning. Zephyr’s
interrupt model backs this up from the other side: a blocked thread
cannot hold off a higher-priority interrupt. On this architecture the
connection event fires on schedule whether your logging call is blocking
or not.
There is a real, narrower version of this risk. Nordic documents
specific known issues in the nRF Connect SDK where a blocking call made
from inside a Bluetooth Host callback, combined with ACL flow control
disabled and the HCI command pool exhausted, can deadlock the Bluetooth
Host or trigger an assertion. A host that’s wedged or asserting will
eventually lose the link to a supervision timeout, which the Bluetooth
Core Specification defines as the timer that disconnects a link once too
long passes without a valid received packet. That is a real failure mode
under specific conditions, but it’s a host-side processing stall rather
than the radio missing an RF event, and it is not something an ordinary
printk() in your application code triggers.
So the blocking is real where it applies, and moving to RTT is worth doing on its own merits. But “it’ll drop your connection” is the wrong reason to do it. The right reason is the one the bench below shows: the console you’re not even printing from is draining your battery.
The bench (the proof)
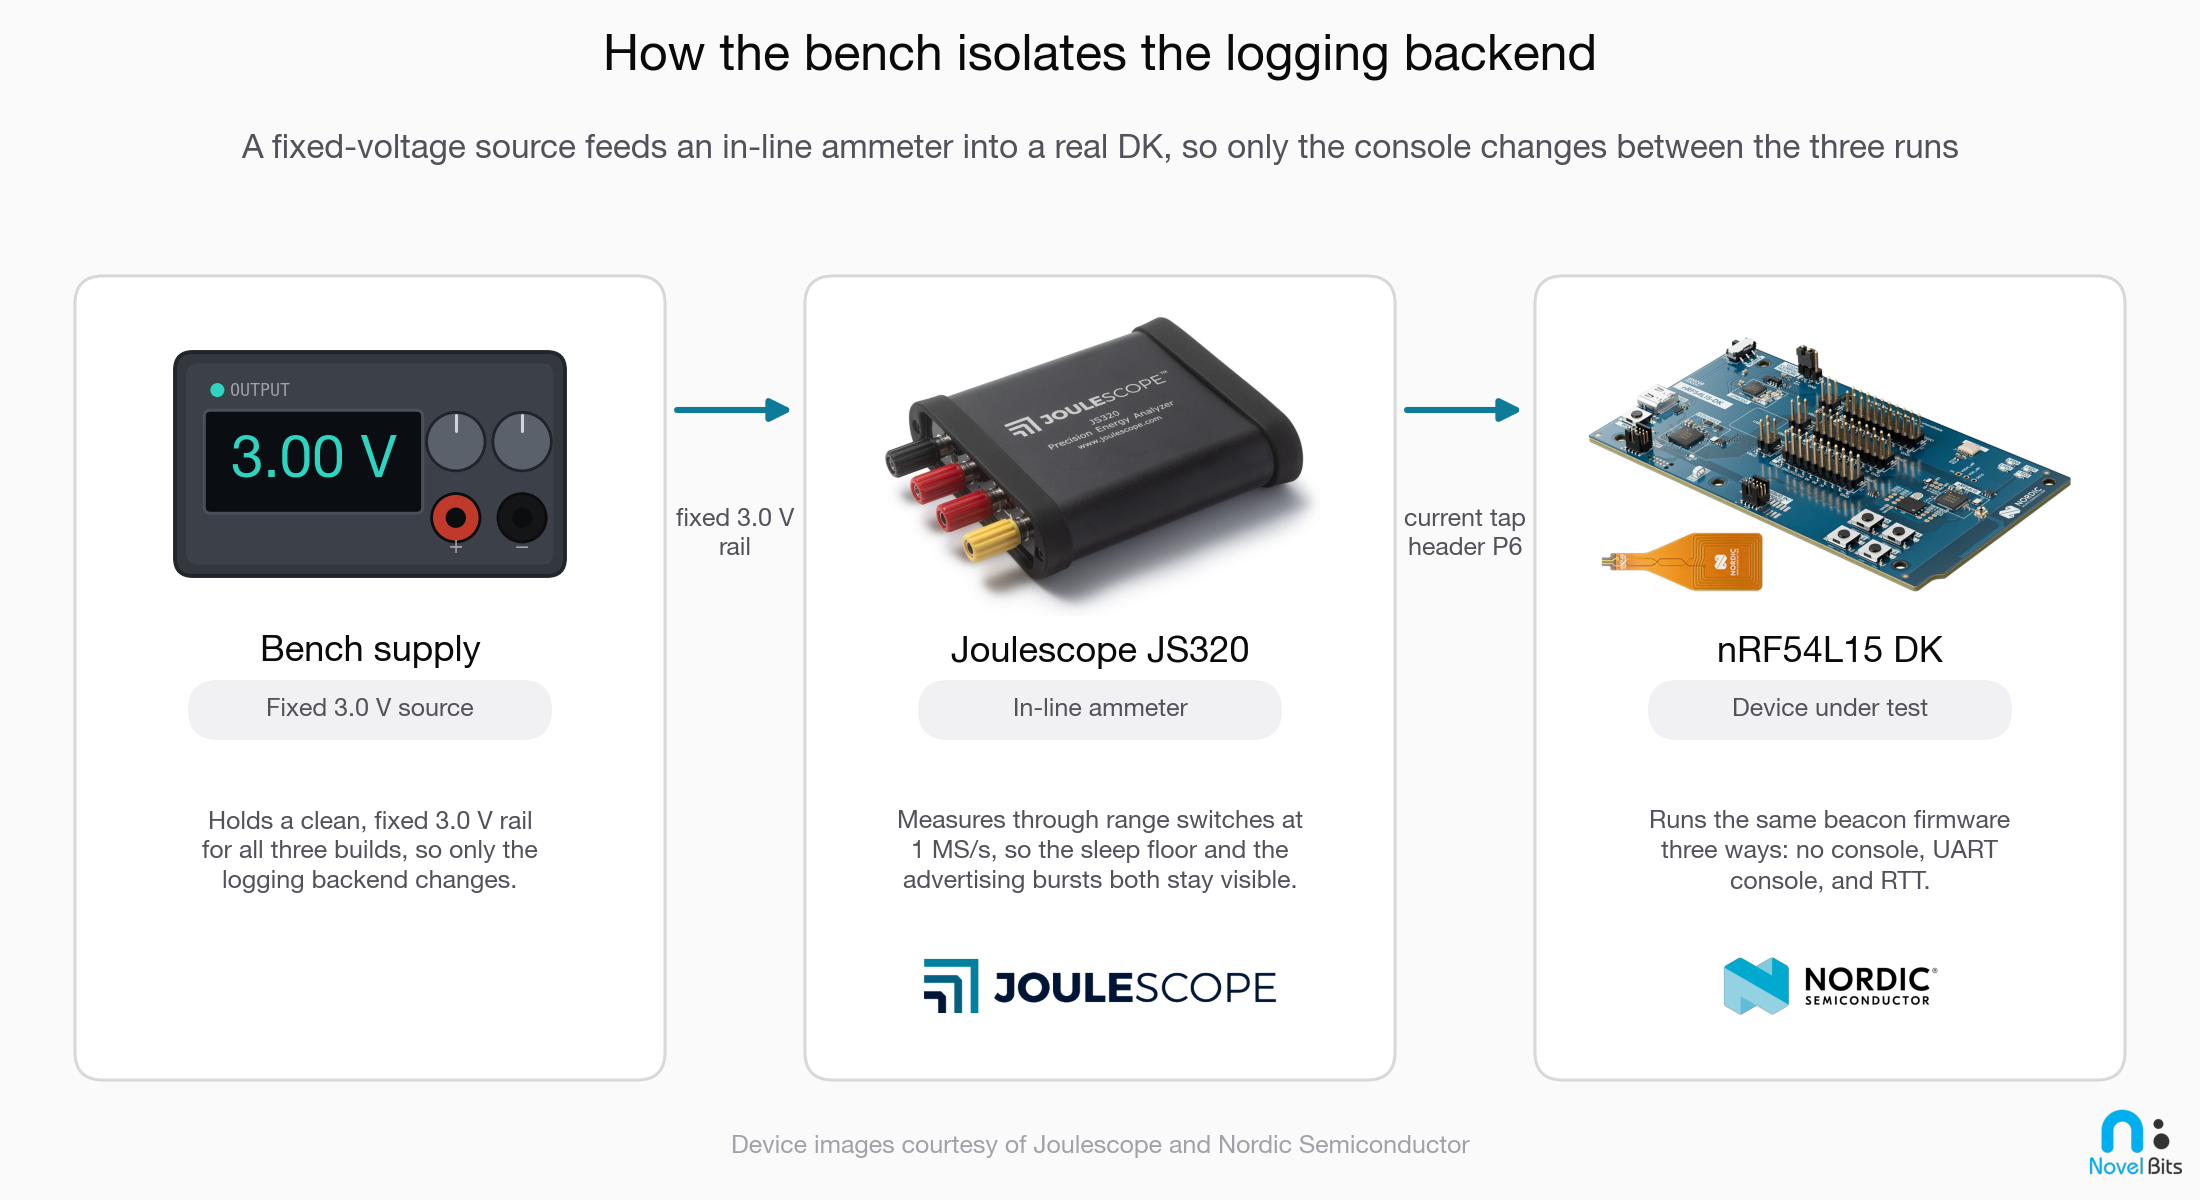
I ran the same firmware three ways and measured each one, with a single constraint: nothing changes except how the firmware talks to me. We’ll go through the three builds, the rig, and the exact Kconfig for each.
The firmware is a bare, non-connectable Bluetooth LE beacon, a single
bt_le_adv_start() call that’s never stopped, so the radio
advertises continuously while the SoC sleeps in between.
BT_LE_ADV_NCONN asks for a 100 to 150 ms interval and the
controller picks within it, which measured out at a 105 ms median period
here. main() returns and the kernel idles. There’s no
periodic printk, no log line in the loop, nothing. That
matters, because it means the three builds differ in exactly one thing:
the logging backend.
- Build A, no console: serial, console and logging all compiled out. This is the honest low-power baseline.
- Build B, UART console: the same beacon with logging
and
printkenabled, which on a Nordic development kit routes the console to a UART. That is what the board’s own defaults give you. - Build C, RTT logging: the same beacon with the console and logging routed to SEGGER RTT instead, and the UART fully off.
The main.c is byte-for-byte identical across all three.
The only difference is a handful of Kconfig lines.
Here it is in full, so you can rebuild it on your own board. The whole thing is four short files and a build command.
CMakeLists.txt, which is pure boilerplate:
cmake_minimum_required(VERSION 3.20.0)
find_package(Zephyr REQUIRED HINTS $ENV{ZEPHYR_BASE})
project(logtrap)

target_sources(app PRIVATE src/main.c)src/main.c:
#include <zephyr/kernel.h>
#include <zephyr/bluetooth/bluetooth.h>

static const struct bt_data ad[] = {
    BT_DATA_BYTES(BT_DATA_FLAGS, BT_LE_AD_NO_BREDR),
};

int main(void)
{
    if (bt_enable(NULL) != 0) {
        return 0;
    }

    /* Continuous, controller-paced advertising. One call, never stopped. */
    (void)bt_le_adv_start(BT_LE_ADV_NCONN, ad, ARRAY_SIZE(ad), NULL, 0);

    return 0;
}
And the three prj.conf files, complete. Build A, no
console:
CONFIG_BT=y
CONFIG_BT_BROADCASTER=y
CONFIG_BT_DEVICE_NAME="NB-Min"
CONFIG_SERIAL=n
CONFIG_CONSOLE=n
CONFIG_UART_CONSOLE=n
CONFIG_LOG=n
CONFIG_PRINTK=n
CONFIG_BOOT_BANNER=n
Build B, UART console:
CONFIG_BT=y
CONFIG_BT_BROADCASTER=y
CONFIG_BT_DEVICE_NAME="NB-Min"
CONFIG_LOG=y
CONFIG_PRINTK=y
Build C, RTT logging:
CONFIG_BT=y
CONFIG_BT_BROADCASTER=y
CONFIG_BT_DEVICE_NAME="NB-Min"
CONFIG_USE_SEGGER_RTT=y
CONFIG_CONSOLE=y
CONFIG_RTT_CONSOLE=y
CONFIG_UART_CONSOLE=n
CONFIG_SERIAL=n
CONFIG_PRINTK=y
CONFIG_LOG=y
CONFIG_LOG_BACKEND_RTT=y
CONFIG_LOG_BACKEND_UART=n
Build any of the three the same way:
west build -b nrf54l15dk/nrf54l15/cpuapp -p autoI built these against nRF Connect SDK v3.3.0. If you are on a newer
one, check CONFIG_LOG_PRINTK still defaults the way it does
above before you trust the blocking discussion.
The rig:
- Board: Nordic nRF54L15 DK,
nrf54l15dk/nrf54l15/cpuapp, board revision 1.0.0, marked 2026.14. - SDK: nRF Connect SDK v3.3.0. I’m stating it because
the
CONFIG_LOG_PRINTKdefault above is a Zephyr default and defaults move. - Supply: a bench supply set to a clean, fixed 3.0 V.
- TX power: 0 dBm, the default.
- Ammeter: a Joulescope JS320 wired inline at header P6, so it measures the SoC’s supply current directly at 1 MS/s. Instruments disagree about bursts more than you might expect. Running the same comparison on a Power Profiler Kit II read the radio bursts about 10% low, and the ratio came out nearer 5 than 4.4. A fast, milliamp-scale transient is the hardest thing on a trace to measure, and the microamp floors either side of it are the easy part.
- Important: every capture was taken with the debugger detached and the chip freshly power-cycled, so the numbers are the firmware’s and not a measurement artifact. More on why that matters below.
One caveat on the floor numbers, and it is Nordic’s own. On the nRF54L Series the internal regulator does not run continuously. A radio event tops up the DECD decoupling capacitor, the core then runs off that capacitor, and a supply-side meter sees almost nothing until the regulator drops into refresh mode. At a 100 ms advertising interval the chip never gets that far between events, so the current you read right after an event is lower than the real idle current. Nordic says so explicitly and tells you to discard the first 100 ms and re-measure at a 1 s interval, so that is what I did. Keep in mind that the two columns of that table do not come from the same captures.
The average currents come from the 100 ms beacon above, measured with the Joulescope, with the console on the kit’s default pins. The floor column comes from a separate set of captures with the advertising interval raised to 1 s, taking the mean of each gap with its first 100 ms thrown away, measured with a Power Profiler Kit II and with the console pins remapped. Those two configurations should differ, for the reason in the last section of this article, and on this board today they do.
Three interleaved runs of each build put the floors within 0.5% of each other. The sub-microamp readings you can see early in each gap are the capacitor, not a deeper sleep state, and any floor quoted from a short advertising interval is measuring the capacitor too.
Two more pieces and you have everything. The floor captures need the
advertising interval raised, in main.c:
static const struct bt_le_adv_param adv_1s =
    BT_LE_ADV_PARAM_INIT(0, 1600, 1600, NULL);

(void)bt_le_adv_start(&adv_1s, ad, ARRAY_SIZE(ad), NULL, 0);
And every console measurement on this kit, averages
included, needs an app.overlay moving the console off the
debugger pins, for the reason in the last section of this article. Skip it and Build B can measure around 341 µA rather than 185, and your
ratio comes out near 8 rather than 4.4:
&pinctrl {
    uart20_default: uart20_default {
        group1 {
            psels = <NRF_PSEL(UART_TX, 2, 3)>, <NRF_PSEL(UART_RTS, 2, 6)>;
        };
        group2 {
            psels = <NRF_PSEL(UART_RX, 2, 5)>, <NRF_PSEL(UART_CTS, 2, 8)>;
            bias-pull-up;
        };
    };

    uart20_sleep: uart20_sleep {
        group1 {
            psels = <NRF_PSEL(UART_RX, 2, 5)>, <NRF_PSEL(UART_RTS, 2, 6)>,
                <NRF_PSEL(UART_CTS, 2, 8)>;
            low-power-enable;
        };
        group2 {
            psels = <NRF_PSEL(UART_TX, 2, 3)>;
            low-power-enable;
            bias-pull-up;
        };
    };
};
Keep low-power-enable in the sleep block. It is what
disconnects the pads when the peripheral idles, and a sleep state
without it is worse than leaving the sleep block alone. Those are the
exact pins the floor numbers were measured on. One caveat before you copy
them: P2.05 is also the on-board flash’s chip select, which is harmless
in these builds because no flash driver is compiled in, but pick
something else, P2.10 for instance, if your build uses the flash. Check
your own board either way.
Each build ran for 8 s of steady-state continuous advertising.
The numbers
| Build (identical firmware, logging backend only) | Average current | Floor between advertising events |
|---|---|---|
| No console | 41.8 µA | 3.4 µA |
| RTT logging | 41.8 µA | 3.4 µA |
| UART console | 184.7 µA | 153 µA, and it never approaches deep sleep |
Let’s look at what stands out.
The average current more than quadruples. The UART build draws 4.4 times what the clean build draws, on identical firmware doing identical radio work, and since average current is what sets battery life, that’s roughly a fifth of the runtime out of the same cell.
Let’s take a look at where that extra current actually comes from. It is not the advertising. The radio does identical work in all three builds, and essentially all of the increase comes from the floor between the bursts rather than the bursts themselves.
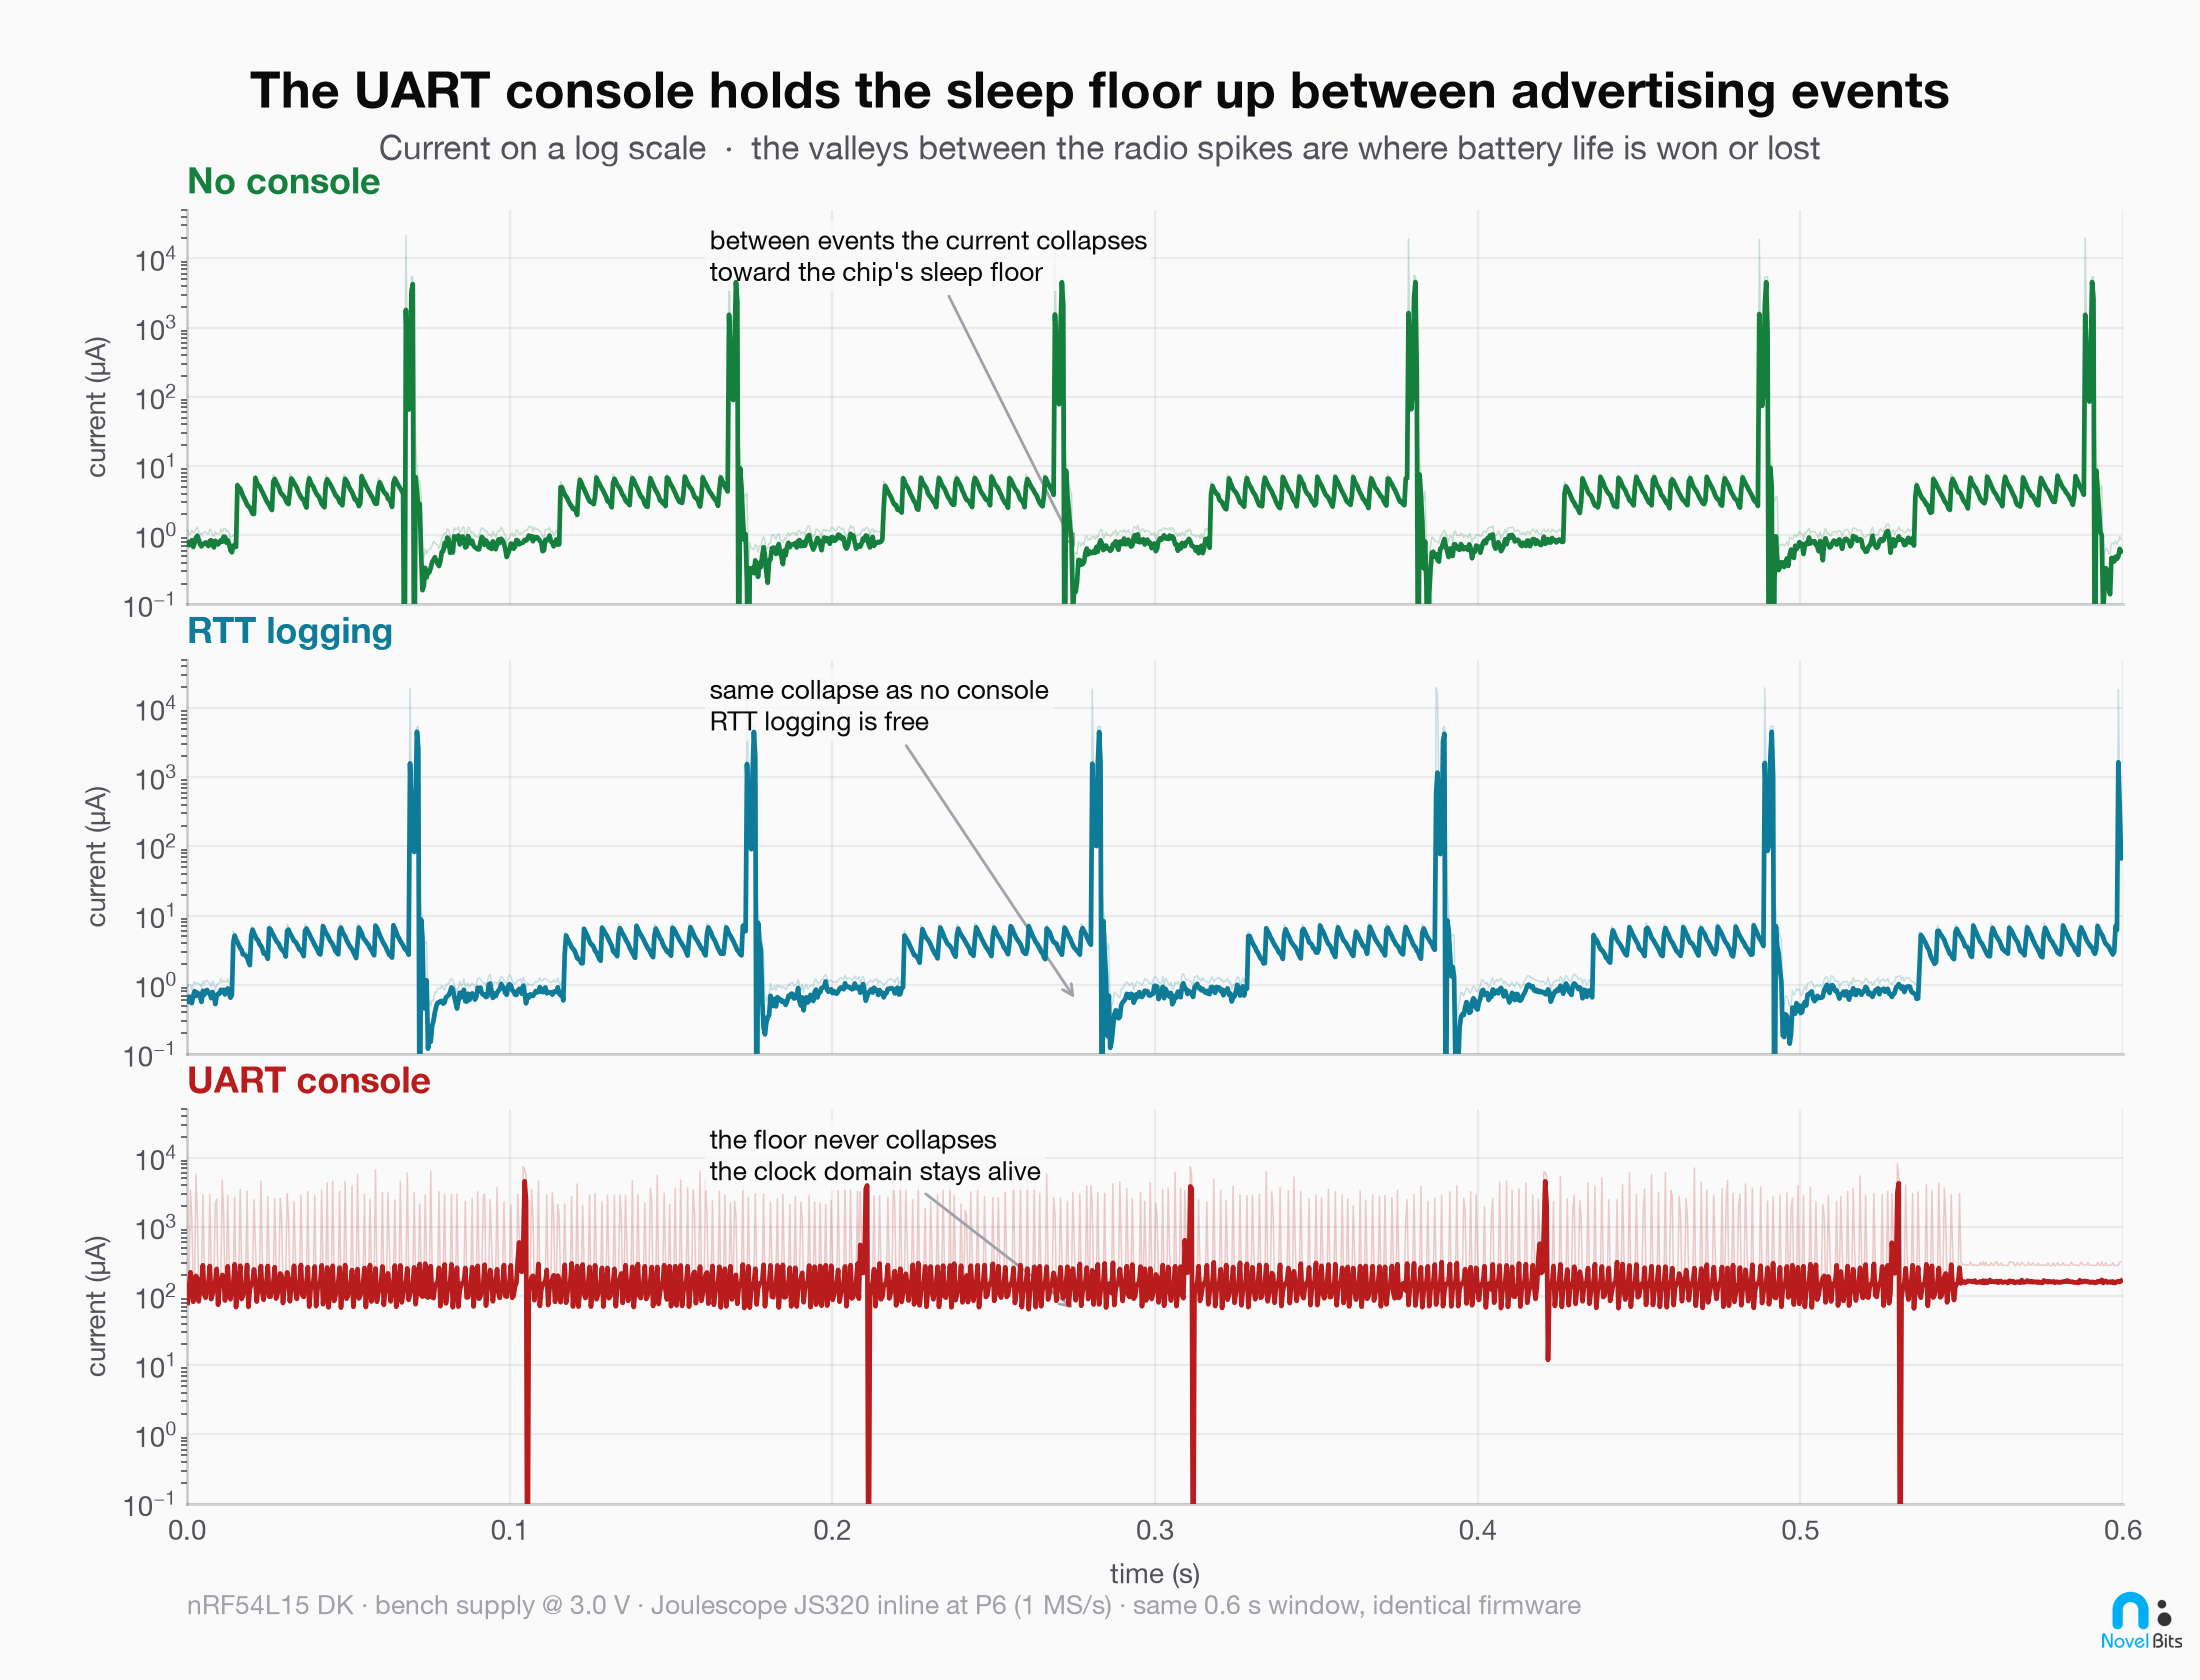
On the clean build the chip settles to about 3.4 µA between advertising events. On the UART build the floor holds around 153 µA and never approaches the chip’s real idle current, so it never really gets to sleep at all. That is a 45-fold penalty on the floor, and because a beacon spends nearly all of its time down in that floor, it’s what drives the 4.4 times average.
The third row is the important one. An RTT backend, compiled in and ready, sits at the same floor and the same average as having no logging at all. Both of those builds were silent for these captures, so what that measures is the standing cost of having the backend, which is exactly where the UART number came from too. Writing a line over RTT is a copy into RAM, not a peripheral that has to stay clocked. You do not have to strip your logging out to hit your power budget. You just have to move it off the UART.
Why a silent UART console is so expensive
Let’s take a closer look at why. The reason comes down to how the clock gets shared. A UART receiver has to be ready for a start bit at any moment, and it cannot sample one without a fast clock already running, so the console subsystem asks for that clock as soon as it’s enabled and never lets go of it. This is not about how fast you can print, it is about being ready to listen. The catch is that it’s the same high-frequency clock the radio depends on, and the SoC aggregates those requests: the clock keeps running until every outstanding request has ended, and it does not care who made them. One request from an idle UART is enough to keep the whole clock domain alive, and while it’s alive the chip cannot get down into the deep idle state where it would otherwise be pulling single-digit microamps.
None of which has anything to do with how much you log. The firmware on the bench never printed a thing. The console sat there enabled and idle for the whole 8 s, and it still held the floor at about 153 µA. A console you forgot you enabled draws the same as one you are printing from constantly.
This is also why Nordic ships a low-power UART driver that adds two handshake lines purely so the receiver can be shut off between transfers, which lets the high-frequency clock stop. If you genuinely need a wire and not a debug probe, that is the shape of the fix.
I checked that on the bench rather than taking it on faith. Turning the receiver off removes about 85% of the console’s cost, holding at 85%, 85% and 86% across 1.8 V, 3.0 V and 3.3 V. The remaining 15% is the cost of having the peripheral enabled at all, which is why turning the console off beats tuning it.
That is also why the UART build’s trace looks busier. At header P6 the meter is watching the input of the SoC’s DC/DC regulator, and with the clock held on the regulator refreshes continuously rather than occasionally. Read the fine structure in Figure 3 with care, though. The extreme excursions in the faint band are the meter changing range, not the circuit, which is its own small lesson about trusting a trace you have not sanity-checked.
Drop the clock and the chip actually sleeps, the regulator hardly has to do anything, and the floor collapses. None of the extra current in that lane is logging traffic. It’s the cost of a clock domain that never shuts down.
Why RTT logging is free
SEGGER RTT (Real Time Transfer, SEGGER’s debug-probe logging protocol) works differently. Your firmware writes a log string into a small ring buffer in RAM and it’s done. There’s no UART, nothing pins the high-frequency clock, and the CPU is awake only for the few microseconds it takes to make the copy. A J-Link reads that buffer out of band over the debug interface, without halting the CPU and without any peripheral on the target generating a clock.
That is why the RTT build in Figure 2 and Figure 3 is indistinguishable from the no-console build. The standing firmware-side cost of an enabled RTT backend is, within measurement noise, zero. That’s the same visibility over a different transport. Nothing else changed between the two builds.
The floor also hides what you should be fixing
There’s a second problem with leaving the UART console on, and it has nothing to do with battery life directly: you lose the ability to see anything smaller than the console itself.
A silent console pins this beacon’s floor near 153 µA, and that is not just an expensive number, it’s a measurement problem. If the firmware also has some other, smaller power sin sitting on top of it, say a peripheral that never got put to sleep, a GPIO left driving, a sensor missing its own low-power command, or a timer nobody gated, you lose the ability to recognize it. Another 20 µA on top of a 153 µA floor is a 13% shift. Your meter can see it, but you cannot tell it apart from console, or from a slightly different build, or from run-to-run variation, and nothing on the trace says which it is. It reads as noise around a number you have already explained.
Drop to the real floor and the same leak stops being ambiguous. That same 20 µA against a floor that should be about 3.4 µA is not a rounding error, it’s nearly 6 times your entire idle budget, and there is nothing else it could be.
This is not a hypothetical. A stray left-on peripheral and a left-on console sit at the same order of magnitude, so you cannot tell them apart until one of them is gone. Turn the console off first, remeasure, and then the real offender, if there is one, stands on its own.
The broader problem is well documented outside this specific floor
mechanism, too. Nordic’s
own power-optimization guide recommends disabling serial logging
before you measure or ship, and shows why on one of their reference
boards: an nRF9160 development kit running a Blinky-style sample draws
about 470 µA average with the UART console on, and about 6 µA with CONFIG_SERIAL=n.
A published test by Qoitech on a different Nordic part, the nRF52840 on a Seeed Studio XIAO module, measured a large console cost there too: average current in active mode rose from 460 µA to 1.34 mA with the console enabled, and the projected battery life fell from 5.9 years to 11.6 days, assuming one wake per hour.
Those two numbers do not scale together, and I cannot reconcile them from what the article publishes. A 2.9 times rise in active current, at one short wake per hour, moves the average by a few percent, nowhere near the 186 times the battery-life figures imply. Getting to 186 times needs the sleep current itself to rise into the hundreds of microamps, which is the same mechanism I measured above, and which the article points at when it says that if the UART clocks remain enabled they may stop the MCU reaching its deepest sleep state. I am citing it because the direction and the scale match what I measured, not because I can reproduce its numbers.
Neither of those sources puts a number on the specific case of a small leak hiding under a UART floor. That part is bench reasoning rather than a citation: a large, constant baseline drowns out a small delta riding on top of it.
So I develop on RTT by default, not just ship on it. A UART console does not only cost you battery on day one, it blinds you to anything smaller than itself for as long as it stays enabled. RTT does not have that floor, so it does not have that blind spot either, and whatever you have not optimized yet stays visible the whole time you’re building instead of surfacing for the first time in a field return.
Measure it right, or you’ll measure the debugger
One trap leads to another. If you go to check your sleep floor with a debugger attached and the core halted, you can measure a floor that’s inflated by tens of times all on its own, because a halted or attached debug session keeps its own clocks alive on some SoCs. Measure that way and you’d never see the console penalty, because the debugger’s own draw swamps it, and you’d never see your real floor either.
The fix is a power-cycle rather than just a detach, and the ordering matters on the nRF54L15. Any J-Link attach, including a flash, puts the chip into Debug Interface Mode, and that state survives closing the debug session: a plain system reset does not clear the debug components, only a pin-reset-class reset or a cold boot does. Nordic’s own production-programming guidance is to finish with a reset that produces a cold boot.
On a development kit with an onboard debugger this is fiddlier than it sounds, because the probe sits on the same board and can re-assert itself. Cutting VDD until the rail actually collapses is the only method I have got to work reliably here, and it is what every number in this article was taken with. Note that pulling the kit’s USB cable is not that method: on this DK it pushes the floor up rather than down, because the target ends up feeding the now-unpowered debugger chip through the pins it is still driving. Whatever you do, take a baseline capture of a build you already know and check that it comes out where you expect before you trust anything else.
One more thing if you go to reproduce this on a development kit, because it caught me badly. The console’s pins usually run to the board’s onboard debugger chip, and on the nRF54L15 DK the receive and clear-to-send lines carry internal pull-ups. In a later session on the same board, the same firmware measured 341 µA with the console on those default pins and 185 with the console moved to pins that go nowhere. The difference tracks supply voltage almost perfectly linearly, about 19 kΩ worth of path, so it is current leaving through the pins rather than anything the SoC is doing.
It is also not always present, so treat a console measurement on a dev kit as suspect until you have checked it against a build whose console pins go nowhere. And do not try to fix it by unplugging the kit’s USB, which makes it worse.
One thing to note is that this is separate from RTT, and the two get confused. Writing to the RTT ring buffer is firmware-only, and it costs the CPU only the microseconds of the copy. Reading it is a separate question: a J-Link has to be attached, and on this part the attach itself is what holds the idle floor up, whether or not the core is halted. So develop on RTT, and when you go to measure the floor, detach and power-cycle first.
“But I need my logs”
You do, and that is exactly why this matters. The reflex is to rip logging out of production builds and fly blind, then wonder why the field units behave differently from the bench. You do not have to. Let’s switch the backend instead and keep the logs.
On a Nordic SoC with the nRF Connect SDK it’s a small Kconfig change, and we’ll walk through both halves of it. Setting the three Bluetooth lines aside, since they are the same in every build, the UART build’s logging config was nothing more than:
CONFIG_LOG=y
CONFIG_PRINTK=y
which is enough on this board, because the nRF54L15 DK’s own board
defconfig already sets CONFIG_SERIAL=y,
CONFIG_CONSOLE=y and CONFIG_UART_CONSOLE=y.
That is worth knowing, because deleting those two lines does not give
you a quiet board. The console is coming from the board defaults and you
have to turn it off explicitly. The RTT build’s logging config, which
measured at the same floor as no console, was:
CONFIG_LOG=y
CONFIG_PRINTK=y
CONFIG_USE_SEGGER_RTT=y
CONFIG_CONSOLE=y
CONFIG_RTT_CONSOLE=y
CONFIG_LOG_BACKEND_RTT=y
CONFIG_UART_CONSOLE=n
CONFIG_LOG_BACKEND_UART=n
CONFIG_SERIAL=n
Your LOG_INF and printk calls do not
change. The output goes to RTT instead of out a UART pin, and you read
it with the J-Link RTT Viewer, JLinkRTTClient, your IDE’s
RTT terminal, or a log viewer built for it. I built LogScope for exactly this
workflow: it reads the RTT buffer directly over the same SWD debug port
your probe already uses, so it is not rate-limited by a serial pin, and
it parses Zephyr and nRF5 SDK log output natively. If your firmware is
built with Zephyr’s Bluetooth monitor backend on RTT, it’ll also decode
the Bluetooth LE HCI traffic inline next to your log lines. The sleep
floor goes back to the chip’s real idle current either way, though.
Either way, what fixes the sleep floor is the backend you log over, not
the viewer you read it with.
The discipline I’ve settled on, and recommend:
- I log over RTT rather than a UART console on every low-power build. Make it the default in your project template, not something you remember to do later.
- If you have to keep a UART console for a specific reason, make sure you measure with it off, or know that every sleep-floor number you report includes a hundred-plus microamps of console you didn’t mean to ship.
- A console costs you whether or not it’s printing. “I barely log anything” is not a defense, because an enabled, idle console is the expensive part.
- I’ve only measured this on Nordic parts, but nothing about the mechanism is Nordic-specific. Any MCU whose UART receiver has to keep a clock running to stay ready has the same shape of problem, though I would not carry my numbers across to a part I have not measured. And as the low-power driver above shows, it is not even inevitable on this one.
The bigger point: measure the thing, do not model it
The reason this catches good engineers out is that you cannot see it in a datasheet or a spreadsheet. The datasheet idle figure is correct. Your power budget math is correct.
The console only shows up when you put a real ammeter on a real board and watch the floor refuse to drop, which is why we measure instead of modeling. A model would have told you a couple of microamps and sent you to production with a part that lasts a fraction as long.
That is the whole reason to keep an instrument on the bench instead of trusting the calculator. The gap between the datasheet number and what you actually measure is usually large, and on a low-power design a UART console is one of the biggest contributors to it, and one of the hardest to spot. On this beacon, against a nominal 220 mAh coin cell, it was the difference between about seven months and about seven weeks, from a nine-line Kconfig change, and that’s before you account for what pulsed radio loads do to a coin cell’s usable capacity.
So before you trust your next sleep-floor number, check one thing: is the console still on? Flip it to RTT, power-cycle the board and measure again. The logs stay, the floor drops back to single-digit microamps, and the battery life you designed for is the battery life you ship. Make that the default in the project template rather than the thing you remember to fix after the first field return.
What the bench showed, in one place:
- An idle UART console raised this beacon’s average current 4.4 times, from 41.8 to 184.7 µA, on byte-for-byte identical firmware.
- It did that by keeping a clock domain the radio also uses alive, pinning the sleep floor near 153 µA instead of letting the chip settle at 3.4.
- It cost that whether or not the firmware printed anything. A silent, enabled console is the expensive part.
- An RTT backend, equally silent, sat at the same floor as no console at all, for one small Kconfig block.
- A 153 µA floor also makes anything smaller riding on top of it unattributable. Develop on RTT and a real leak stands on its own; develop on UART and it hides inside a number you have already explained.
- Measure with the debugger detached and the board freshly power-cycled, or you’ll measure the debugger instead of your firmware.

Bluetooth LE Power & Battery-Life Consulting
I help product teams measure real current draw, find the hidden drains a console leaves running, and turn battery-life claims into defensible, bench-verified numbers.


